
Blog article: Quarterly Update (Q2 2026)
Article text
At Toronto Open Data, we like to work in the open. To that end, here’s a summary of how the Toronto Open Data Portal is doing and what our team accomplished between April to June in 2026.
Summary
Q2 2026 was a quarter of surprisingly steady momentum for us; we typically get less usership and traffic around summer months, but this Q2 didn’t see real drop from other quarters.
We Tackled the Backlog
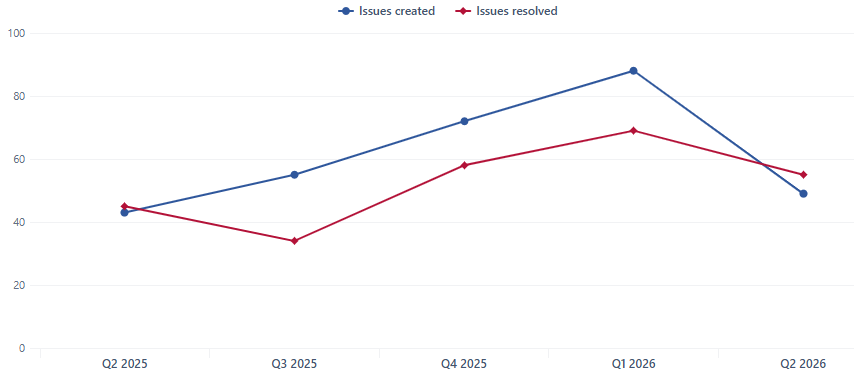
Over the last year, we received 20 more requests each quarter to publish and update data than we were able to resolve. This quarter, we received half as many requests, and so we spent this quarter clearing our backlog (some tickets we’d been working on for over 300 days)
Bots Sought Police Data
Our Bicycle Thefts, Neighborhood Crime Rates, Hate Crimes, and especially Thefts from Motor Vehicle datasets all saw noteworthy spikes in viewership. Based on the location the traffic came from, we suspect it’s bots.
Council Objectives Steered Open Data Publication
Council’s ask to publish city washrooms on a map and council cracking down on bad landlords were major motivators for the 12 new datasets published these past 3 months. Because we spent time on creating those datasets, we made ~20 fewer significant updates to existing datasets this quarter
AI will be a useful tool
We spent time in Q2 developing an AI assistant for a chatbot-style site-wide search. While we found that the assistant did the job well, we’re going to pause work on this AI enabled search until we’ve sorted out some technical fundamentals (like metadata management).
We are connecting Datasets and Projects
In talking with users at (among other places) our monthly open data events, we found that people want to see projects (apps, articles, websites, etc) that use particular datasets. In the coming weeks, we’ll be updating the Open Data Portal so that dataset pages also show related projects from our gallery.
Performance and Key Metrics
Traffic and Consumption

Traffic and consumption this Q2 were our highest for the Q2s we’ve recorded (ie: since 2023), continuing our slow overall upward trend. See below our clicks-to-download and above our views, sessions, and users the previous quarters on record

In the past, the portal sees less traffic during summer months and winter break (presumably caused by a decrease in academic traffic). This quarter still supports this pattern, but less than usual.
We partly attribute this to the significant increase in viewership to our Bicycle Thefts, Neighborhood Crime Rates, Hate Crimes, and especially Thefts from Motor Vehicle datasets, which we suspect comes from bots. We suspect this, as most traffic came mostly from Des Moines, Pheonix, Chicago, San Antonio, which are all cities with numerous data centres. What’s noteworthy here is that this is the 2nd quarter in a row we’ve had spikes in viewership that we suspect to be associated with bots. We assume they’re training AI models or indexing content for search engines using our content.
Requests and Publication

Requests for publication dropped this quarter, and so we took advantage. We’ve had an exploding queue since last year (meaning the issues, or tickets are coming in faster than we can resolve them). In the chart on the left, you can see how this quarter had a drop in how many new tickets we received, so we spent that time resolving all the requests we couldn’t get to previously.

Many of those tickets were really old! You can see in the chart on the left the average number of days (the blue bars) it took to resolve a ticket (ie: to publish/update a dataset, determine that it was possible, or determine that it was impossible). In Q2, the average resolution time was 100 days, meaning we were resolving issues from previous quarters. 18 of those tickets were over 100 days old, 5 of them were over 200 days old and 2 of them were over 300 days old.
Ultimately, we published 12 new datasets and made 21 major updates to datasets (a major update is a change to a data schema, source, or noteworthy fixes to its metadata). Of note, we published Highrise Health Inspections data along with council’s motion to start cracking down on bad landlords, and added historic versions of our very popular 3D Massing Dataset.
Product & Platform Enhancements

We’ve heard many times that users want to know what projects are built on top of a particular dataset (so they can get involved in the project or use it to get insight about a topic), so we made connections between gallery project pages and dataset pages.
These connections can go two ways: they can show you what datasets a particular project uses and also what projects use a particular dataset.
We tested this interface with the help of some enthusiastic members of Civic Tech Toronto, a civic technology group that has been running meetups every Tuesday since 2015.
We hope this feature helps folks find useful things built on open data, and encourages more folks to submit projects to our project gallery
We also spent time this quarter testing an AI assistant to see if it could serve as a chatbot, helping users search our whole site (not just datasets, but also blog posts, projects, documentation, and ongoing requests for new data). We found pretty clearly that the assistant absolutely can get the job done. That being said, we’ve decided not to embark on deploying anything on top of it this year like we initially planned in our 2026 Roadmap until our program has made some fundamental improvements to our platform (mostly in the area of metadata).
Community Engagement
Engagement
We continued our monthly open data jam sessions (we did them in April, May, and June, and have more planned) where we meet with different open data users, listen to how they use data and what pain points they have. This is important for us; we don’t require user accounts on the open data portal, so we don’t have any strong way to track who is using our data and what problems they might be experiencing.
Our sessions included an event at (and in partnership with) the Toronto Public Library and the creator of the Toronto Library Passport App, and a Toronto Tech Week event that drew in a crowd of 60 (about double our usual) entrepreneurs, students, professionals and technologists from various sectors.
These sessions tell us a lot, and we’ve consistently heard that people want:
- More transit data
- To hear details about our rate limiting
- More ways to collaborate with/on top of open data
- More events
All told, we were involved in 16 other events either as hosts, presenters, or attendees, with members of the open data community (including folks other than users, like other open data cities and other City of Toronto staff).


Social Media
Our social media performance steadily improved this quarter compared to the last. Impressions and reactions increased by 30%, and shares and comments increased by 90%.
As an April Fool’s joke, we published a fake dataset about raccoons in the city. It got 5 times for impressions than our next most popular post across all platforms.
Spotlight and Insights
Toronto Public Health, the city division focused on protecting and promoting the health of Toronto residents, made noteworthy additions to their open data footprint this quarter.
Published Highrise Residential Health inspections
A new dataset of things like mould and bedbugs found in condos in the city council’s recent motion to start cracking down on bad landlords in the city
Published Swimsafe inspections
A new dataset of inspections of recreational water facilities and natural swimming areas, determining whether they meet provincial health regulations
Updated Dinesafe inspections
A dataset we’ve had since 2010 listing inspections of all establishments serving and preparing food; Toronto Public Health added fields to ensure establishments old and new unique identifiers are publicly available, and helped fix a bug that incorrectly hid some inspections.
What’s Next?
Over the next 3 months, we’ll be building some features that enable users to be alerted of incoming changes to datasets. We’re still ironing out the details of what exactly that will be (whether it be an atom feed or emails or more regular comms through social media or a combination thereof), but we hope to have something developed by the end of September.
Thanks for reading and see you next quarter! As always, you can reach us at opendata@toronto.ca or tell us about datasets you’d like to see via our requests portal.