Blog article: Exploring Cleared Building Permits
Published on August 28, 2017

Article text
The City of Toronto publishes data on building permits going as far back as 2000. Excited about this, we at the Open Data Team asked ourselves: how might we learn from the Cleared Building Permits? Could we use it for improving our understanding of Toronto and how we deliver services to the community? In this data story, we walk through our process and share the materials created, from data preparation to visualization, for you to use as a starting point in your own analysis or to follow along.
We are always seeking to improve data stories – please share your thoughts on how to make them better. Feedback is welcomed via email (
opendata@toronto.ca), or Twitter (
@Open_TO).
[toc]
Background: About the Data
A building permit is formal permission from the city to begin construction, demolition, addition, or renovation on your property. Permits move through five stages:
- Application: drawings, documents, and forms depending on the type of permit submitted
- Review: City Building staff review plans to ensure compliance, applicants may have to revise plan until compliant
- Issue: Plans are approved and construction can begin
- Inspection: Toronto Buildings staff inspect the project to ensure adherence with permit submitted, construction is deemed compliant after inspections are completed and passed
- Close: Applicant contacts the city, inspection results are confirmed, and permit is considered completed
Permits are considered Active until closed. Both Active and Closed permits are available in the open data catalogue, under separate datasets, however the scope of this story is limited to Closed permits – permits going through the process will not be present.
Finally, note that in the portal “Closed Permits” are referred to as “Cleared Permits”. This will be standardized in the future.
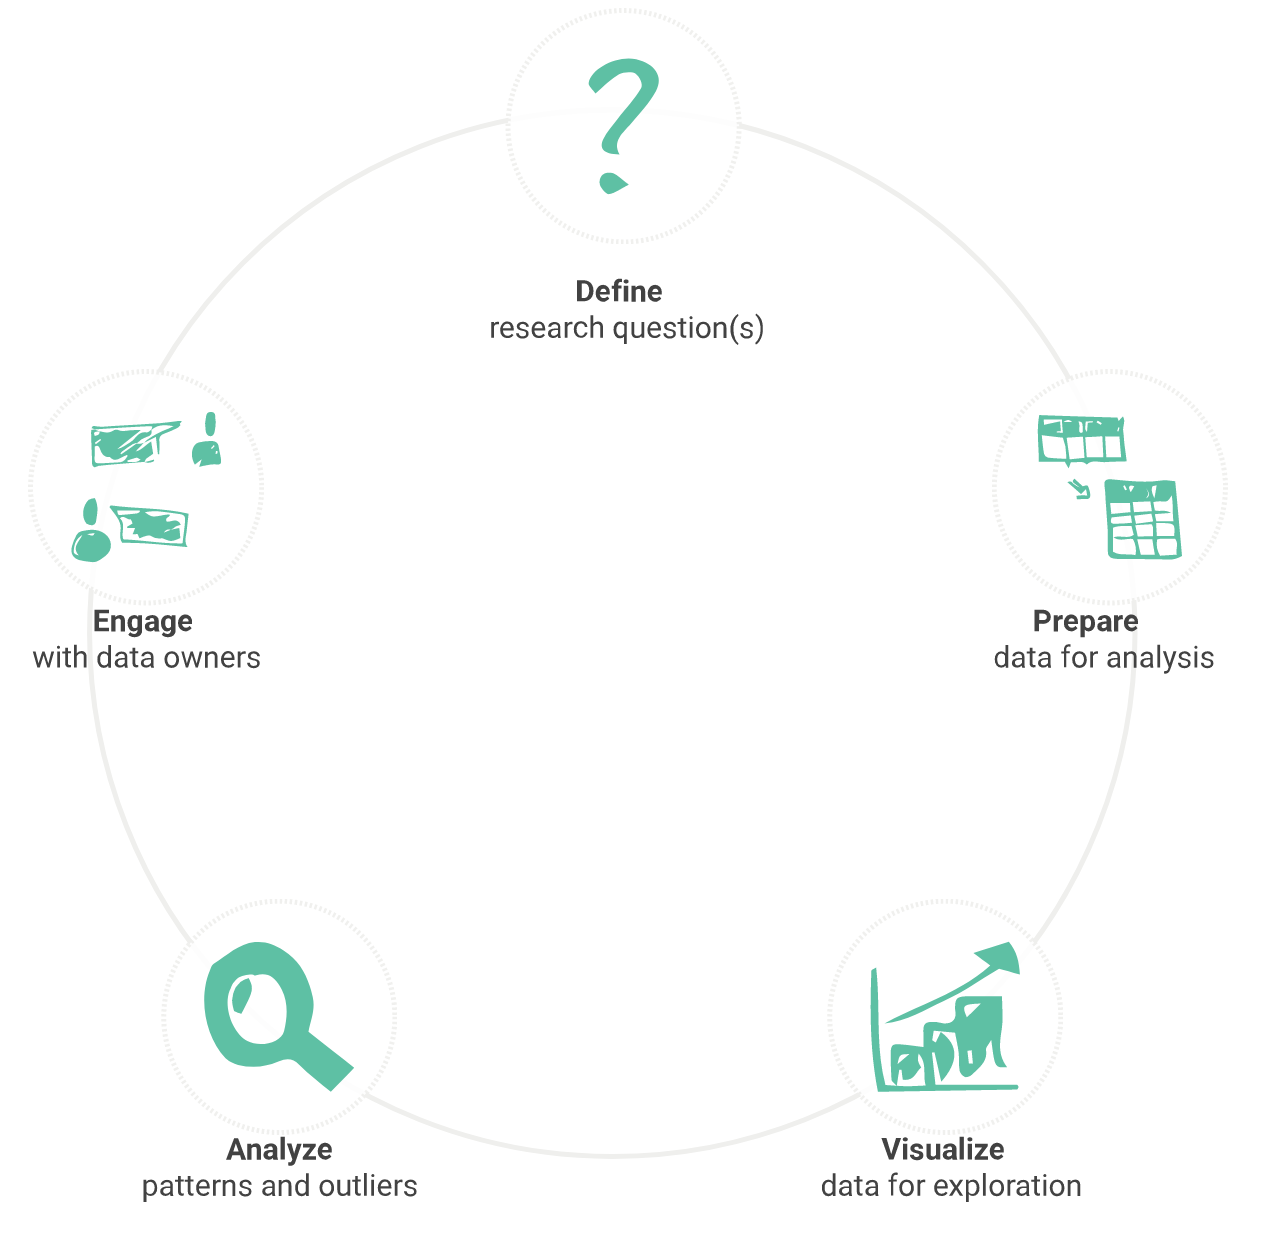
Step 1: Define Research Questions
“If you don’t know where you are going you might not get there.”
– Yogi Berra
Data analysis projects must begin by defining, at least, one question you hope to answer with the data. Although normal to revise these research questions throughout the process, they primarily serve as a launch pad from which to begin; indeed, it is simple to get caught in an endless cycle of analysis without synthesizing it into a practical application.
Given their open-ended nature, formulating these questions can be quite difficult. We followed a two-pronged approach consisting of personal interests and the data itself.
First, initial ideas were derived from the team’s personal interests in Toronto housing-related trends. For instance, questions revolved around types of permits issued, availability of housing over time or place, and how trends compare to the cost of real estate.
Then, we familiarized ourselves with the data to refine our questions and come up with completely new ones. In-depth understanding of the data was not needed at this stage so, instead, we used the column descriptions available in the portal. This is known as the
metadata.
A better understanding of the metadata helped us determine if the initial questions could be answered by the data and, also, come up with new ideas – below are some example questions derived from the metadata.
| Data Columns |
Research Question Ideas |
Comments or Observations |
| Permit Num
Revision Num |
How has the number of permits closed varied over time?
How long do revisions take? |
Permit Num is a unique identifier for internal use. To find an issued permit you will need the complete permit number, which is composed of Permit Num and Revision Num |
| Permit Type
Structure Type |
How have the types of permits closed or building structures changed over time? |
|
| Work
Description |
What different types of work are performed by permit type? Is there a trend over time? |
Both fields provide an overview of what will be done, except Work is more general and Description more detailed |
| Geo ID
Street Num
Street Name
Street Type
Street Direction
Postal |
Is there a relationship between permits issued and neighbourhood or other geographical location? |
GeoID is an internal unique identifier could be joined with the Address Points dataset, facilitating accurate mapping. Alternatively, could also geocode base on the individual address components. Due to license limitations postal codes are only available from Canada Post so only the Forward Sortation Area (FSA) portion, first half, is provided |
| Application Date
Issued Date
Completed Date |
How long does it usually take for permits to go from application, to issue, to completion? |
The time between Application and Issue is the Review Period, and from Issue to Completion is the Inspection Period |
| Status |
What is the relationship between permit status and type? |
Permits can be cancelled for a number of reasons, many outside of the City’s control, so these would be excluded from the analysis |
| Current Use
Proposed Use |
Are there discernible trends around repurposing certain buildings for specific uses? |
|
| Dwelling Units Created
Dwelling Units Lost |
How has the number of dwelling units changed over time? |
These fields represent the net difference of units created and lost across permits, for example:
1. Demolition permit eliminates 10 dwelling units
2. Replacement permits (New Building) creates 15 dwelling units
3. New Building permit recorded as Dwelling Units Created = 5 |
| Assembly
Institutional
Residential
Business and Personal Services
Mercantile
Industrial
Interior Alterations
Demolitions |
How does the Gross Floor Area (GFA) covered by permit work vary between types? |
GFA is provided in square metres. Note that not all permit types, such as Plumbing and Mechanical, have an associated GFA |
Essentially, this two-pronged approach enabled us to balance what
we want to learn (e.g. personal interests) with what
we think we can learn given the data. After this we narrowed scope of analysis the following research questions:
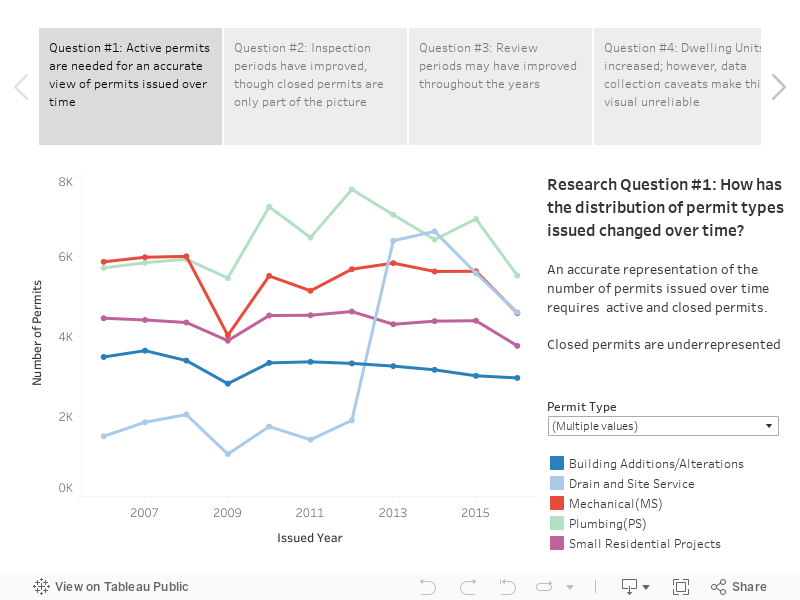
- How has the distribution of permit types issued changed over time?
- Has inspection period length improved over time?
- Has review period length improved over time?
- How has the number of units created changed over time?
Step 2: Prepare Data for Analysis
Past experience has taught me that the vast majority of time in analysis projects is spent on
preparing data for analysis and this time was no exception. This usually involves tasks such as:
•
Cleaning, e.g. identifying and addressing errors in the data
•
Reshaping, e.g. breaking up datasets into multiple datasets
•
Transforming, e.g. calculating number of days from two date fields
CONSOLIDATION
Cleared building permits are available in multiple comma-separated value (.csv) files, one per year from 2000 to 2017 (year to date). These 17 files were consolidated for analysis via the Python script below.
TRANSFORMATION
Work on the dataset beyond file consolidation was necessary to be able to analyze the data. Various issues were addressed during transformation, including but not limited to:
- Ensuring columns contain the correct data types so math can be performed on numerical fields and time operations on date fields
- Calculating time intervals between dates to calculate review and inspection periods from the columns
- Sorting permits to calculate time between permit revisions, which must be calculated by rows
Data was transformed per the following Python script.
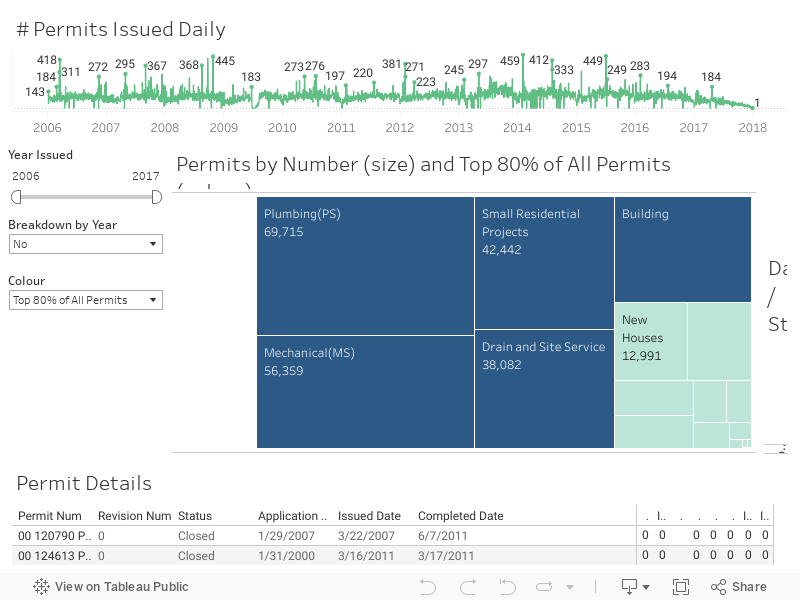
Step 3: Visualize Data for Exploration
Next, visualized the data to explore it and hopefully generate some insight. Although the data could not have been processed raw due to issues like the ones above, data was ready for consumption by data visualization software after the transformations performed in Step #2.
As mentioned, experts in this dataset revealed to us there are two distinct aspects to the data: permits issued up to, and after, 2005 due to changes to several changes to rules around the data, such as classification. Visualized only the permits issued post-2005 because they are more relevant and because the changes rendered time periods incomparable.
Created the dashboard in Tableau Public, the free version of Tableau Software’s leading data visualization software, to create an interactive dashboard for “slicing and dicing” data – feel free to explore it yourself below.
Step 4: Analyze Patterns and Outliers
Several insights were revealed from data exploration. Some of these help answer the research questions posed and, others, were uncovered while attempting to answer the questions – perhaps not directly related but valuable nonetheless. Learn about these below, best viewed in Full Screen (button on lower right).
Step 5: Engage with Data Owners
The next step was to with internal subject matter experts to review findings, get clarification on anomalies identified, and uncover other insights. Knowledge sharing from the experts proved essential towards validating the process and findings and providing much-needed context. Indeed, that insight enabled a much deeper understanding of the data and thus a higher quality analysis.
A great deal was learned from the experts. Although too much to list everything, the major lessons were:
- The relationship between closed and active permits, and why considering both is key for understanding the whole building permits story. Having only one is inherently limiting, primarily because issued permits can remain active for long time periods until the final step is taken by the applicant.
- The relationship between Mechanical and Plumbing permits with other permit types, and how multiple of these can be issued with other permits (a new building, for example, may entail several of these).
- Spike in Drain and Site Service permits in 2013 onwards was due to the floods and the prevention subsidy program</.li>
Every lesson learned enhanced the quality of the analysis. My advice is to always speak with the experts of the data as their knowledge adds an invaluable dimension to an analytics project.
Next Steps: Ideas
Sometimes analytics projects pose more questions than they answer, maybe because the more you know, the more you realize you
don’t know. And to a degree this held true in this case.
This analysis can certainly be improved in multiple ways and can be taken in many directions. Personally, the most promising of which would be inclusion of Active Permits to the data being analyzed. This will provide a much more holistic picture of permits across the city. Understanding the relationships between various permits types could enable normalization and allow more accurate comparison between them. Finally, joining this data to different datasets would lead to new opportunities for insight – personally, I am interested in exploring what can be learned from mapping permits by address.
Depending on the team’s priorities around data stories, these enhancements may follow on a Part II. More rewarding for me would be if someone in the community to uses this story as a starting point and builds on it! We invite you to do so and share with us what you find.
Summary: Tools & Scripts