Blog article: Toronto’s $1.7B Parking Enforcement System
Article text
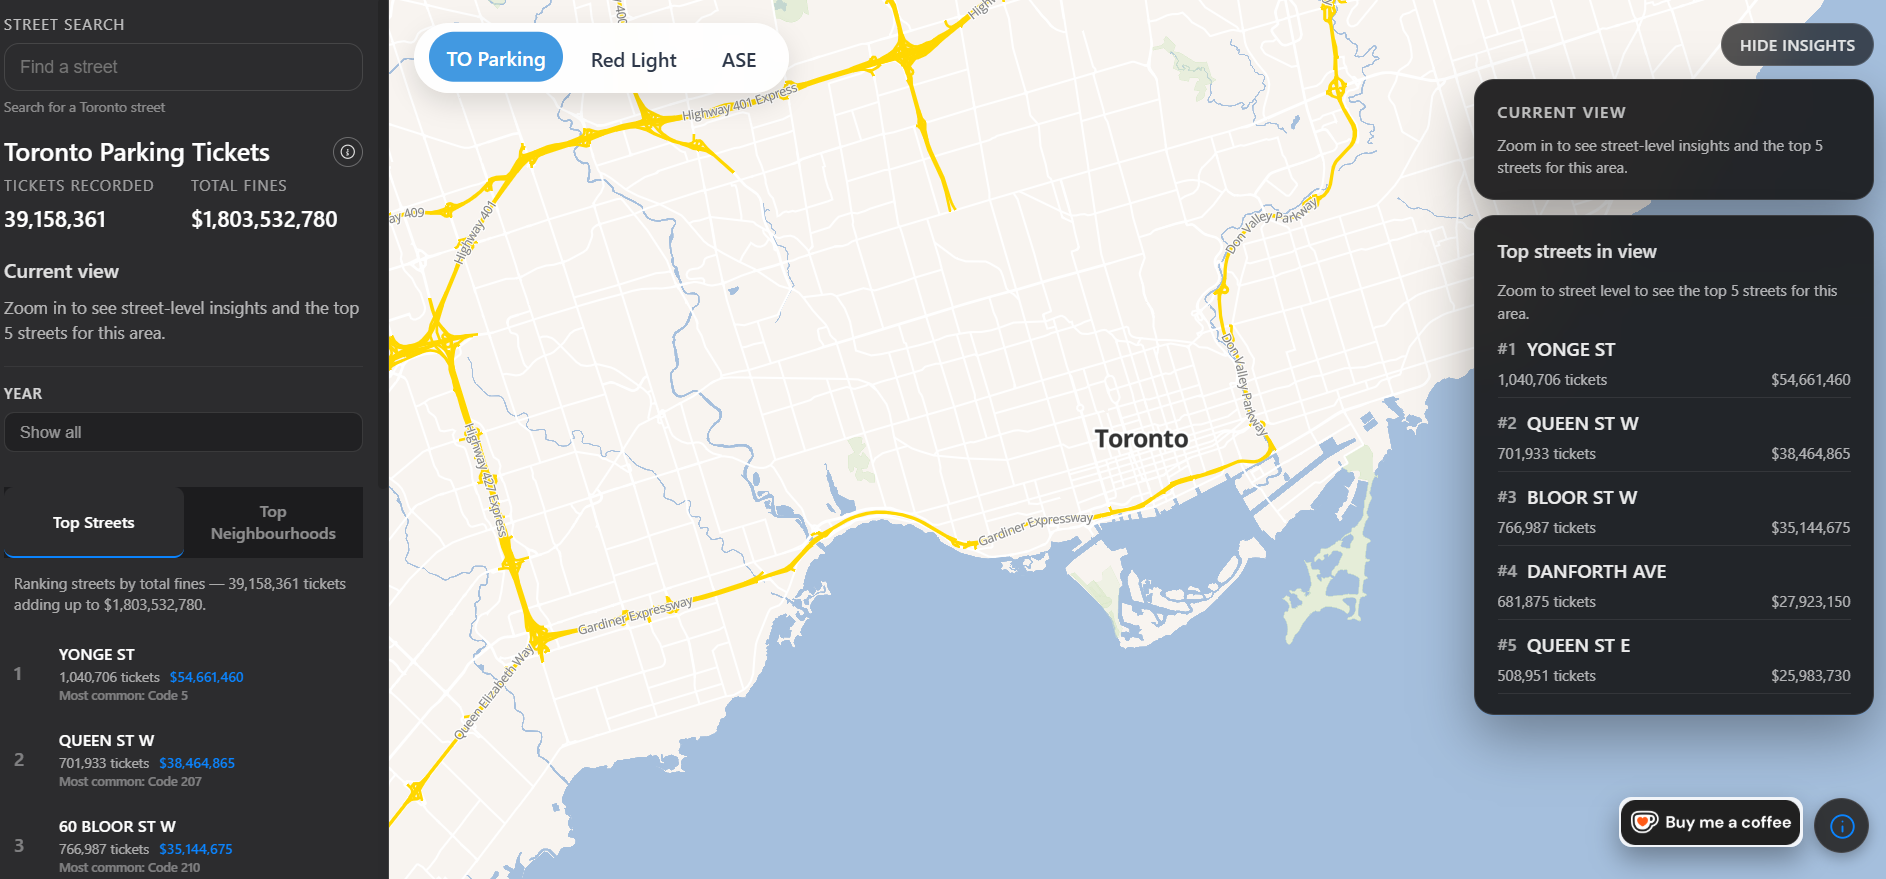
Toronto’s parking ticket dataset — 37 million records across 17 years — is one of the largest municipal enforcement datasets in Canada. It tracks how we share curb space, how bylaws are enforced, and where the city focuses its attention.
Open data should tell stories, not sit in spreadsheets. The City provides a CSV file with 37 million rows, but that alone doesn’t tell you much. So I built a system that turns that mountain of tickets into something anyone can explore: a searchable map and a set of live analytics showing how parking enforcement actually works in Toronto.
The Challenge: 37 Million Rows, 0 Context
Here’s what’s in the raw data:
- 37 million tickets (2008–2024)
- 658 different infraction types
- 722,000 variations of street names
- $1.72 billion in total fines
- 2.29 million unique violation-street combinations
If you’ve ever opened one of these datasets, you know the problem. It’s complete, but it’s chaos. Streets are misspelled. Codes don’t line up. And simple questions — Where do most tickets happen? — take minutes or hours to answer.
That’s what I wanted to fix. I wanted a way to ask, “What does enforcement in Toronto actually look like?” and get a clear answer in under a second.
Step 1: Start With Trustworthy Data
Before doing anything else, I checked the data quality. All 37 million records had valid infraction descriptions. What I found was there were no blanks or corrupted fields, which saved me a ton of time!
Then I started matching violations to streets and locations. That’s when something interesting showed up: 4700 Keele Street alone had over 100,000 tickets, most for parking on private property. It was an early sign that enforcement isn’t evenly spread across the city.
Step 2: Build the Foundation
Once I knew the data was solid, I focused on making it usable.
Street names were a mess — “King St W,” “King Street West,” “KING STR W,” and a dozen other forms, all meaning the same place.
To fix this, I used Toronto’s Centreline dataset as the reference and ran fuzzy matching using Levenshtein distance to find the closest real street for every ticket.
That process collapsed 722,000 messy variations into about 10,000 clean street segments. Suddenly, maps worked & geographic patterns became visible.
Database and Caching
The database runs on PostgreSQL + PostGIS for spatial queries. I added materialized database views for common summaries — top violations, total tickets, fines, exact locations of your top streets in view.
Then I layered Redis caching on top. The cache holds the most frequent queries — things like “most ticketed streets” or “top neighbourhoods” (among others)
Cached results refresh automatically every day or week, depending on the query. The goal was simple: no waiting to see your results.
Step 3: Show the Patterns
Numbers tell you what happened, but visuals show you how.
Here are some of the charts I built:


Each chart tells a small part of the story: Toronto’s enforcement system is predictable, consistent, and concentrated.
Step 4: What the Data Says
A few big takeaways stood out:
- Enforcement is stable. After 2015, total volume barely changed year to year.
- A handful of violations dominate. Ten types of infractions make up 80% of tickets.
- Summer is the busy season. Warm months bring 60% more enforcement.
- Geography matters. A few streets — and even individual addresses — drive a disproportionate share of all enforcement activity.
Why This Matters
This dataset doesn’t explain why certain areas get more attention — that needs more context, like traffic, zoning, or complaints data — but it gives everyone a factual starting point.
Key Metrics
| Metric | Finding |
| Total Tickets | 37.0 M (2008–2024) |
| Distinct Violations | 658 descriptions, 270 codes |
| Average Fine | $46.39 |
| Fine Levels | Most fines are between $30 and $50; only 5% go above $100. |
| Yearly Trend | Ticketing grew fast from 2008–2014, then leveled off. |
| Top Violation | “Park-Signed Highway Prohibit” (3.3 M tickets) |
| Seasonal Shift | Summer ≈ 60% higher than winter |
| Normalized Streets | ~10 K canonical segments |
You can explore the same data on open.toronto.ca.
The full analysis and exports live at github.com/monuit/toronto-parking.
Questions or ideas? Reach out at hi@monuit.dev
About Me
I’m Mohammad Abdulhussain (Mo) — a data scientist who works on civic analytics and open government. I built this project to make Toronto’s enforcement data accessible and useful, not just available.
When I’m not cleaning datasets, I’m usually thinking about how cities can use open data to make fairer, smarter decisions.