Blog article: Quarterly Update (Q1 2026)
Article text
At Toronto Open Data, we’re putting in effort to make sure we work in the open. To that end, here’s a summary of how the Toronto Open Data Portal is doing and what our team accomplished between January to March in 2026.
Summary
Q1 2026 was a quarter of steady momentum and meaningful progress for Toronto Open Data, both in how data is being used and how we’re delivering it.
Demand is growing and getting more complex.
We received 88 requests this quarter, 15 more requests than last quarter. While we only resolved 69 requests, rising demand, especially for more complex datasets, means we are continuing to evolve how we prioritize and deliver.
Data Usage is on the rise
Dataset downloads was 6% higher than Q1 of 2025, with 28522 total downloads in 2026. Overall engagement continues to trend upward, reinforcing that more people are not just visiting the portal, they are actively using the data.
We are expanding and improving the data ecosystem.
- 3 new datasets published
- 40+ datasets significantly updated, compared to ~27 last quarter
- Key datasets, like Motor Vehicle Collisions, now updated daily instead of annually
Product improvements are making data easier to find and use.
From a redesigned homepage to a more powerful dataset explorer and a new public request platform, we are reducing friction and making open data more accessible than ever. Downloads last quarter in this quarter are the highest they’ve been on record since we started tracking them in 2021
Our reach is growing beyond the portal.
Social media engagement increased by 63% each month this quarter, helping us connect with new audiences and drive more meaningful interactions with our data.
Community remains at the core.
From Open Data Jams to the Open Data Awards and hacknight participation, we are continuing to build strong feedback loops with the people who use and rely on our data.
Performance and Key Metrics
Traffic and Consumption
Generally speaking, traffic and consumption this Q1 were on par with previous our previous 3 Q1s. Overall, though, the trend for views to pages and downloads of datasets is steadily increasing.

This February had the highest clicks-to-download we’ve recorded in the last few years. This is encouraging for us because other metrics we examine, like page views, only don’t necessarily mean that someone is using data; it just shows us that someone is looking at a page.
Speaking of views, we saw a brief spike in views to one of our datasets relating to Renewable Energy Installations. The associated sessions came from a blog we’d written in 2024, and averaged 60 views to this blog per session. All these views came from the same 5 or 6 cities in the midwestern United States, so we assume these are from an enthusiastic data center over there.
Requests and Publication
Requests for new data have been increasing steadily. This quarter, we weren’t able to address as many requests as came in.
| Requests made | Requests resolved | |
| Jan 2026 | 34 | 23 |
| Feb 2026 | 15 | 22 |
| Mar 2026 | 39 | 24 |
These tickets come from many places. In Q1, most came from public requests made to our inbox or through our public requests page. Each varies in complexity quite a bit (for example: data that needs PII obfuscated takes more time to publish than a republication of data that’s already on toronto.ca).
We published 3 new datasets:
- Area Speed Limit Reductions: a list of wards and whether the speed limits of their on select local roads and laneways have been reduced, as per the City’s Vision Zero Road Safety Plan.
- 2 datasets on Private Transportation Companies in the city:
The rest of our resolved requests 60+ related to updates/changes to existing datasets. Of note, our Motor Vehicle Collisions dataset (which used to be updated annually) is now updated daily.
Product & Platform Enhancements
We deployed 2 shiny new features to open.toronto.ca this past quarter.
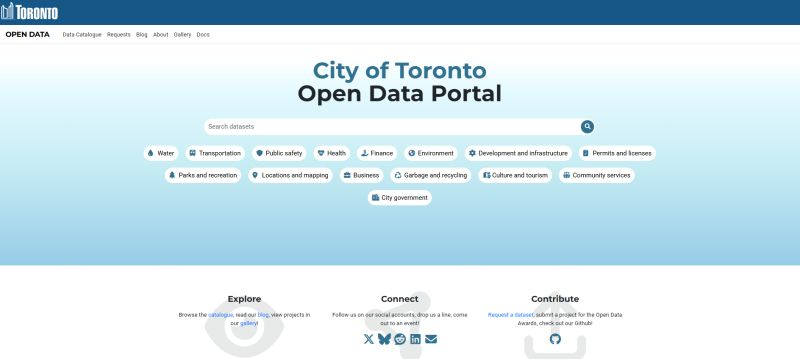
The first is our new homepage; we’ll be using this to display events we’re involved in, highlight new requests for data and new blogs, feature uses of Toronto Open Data from our gallery, and highlight new datasets.
The second is our upgraded explore section; it lets you “fuzzily” search a dataset really easily, and even download just the records your search returns you. We’re hoping this will help users get an idea of what’s in a dataset before they decide to use it for something more complicated or difficult.

We’ve done some non-feature specific work, too. We’re operationalizing a way to publish data from staff reports on the portal. Council passed a motion asking for this in 2021, and after a long series of research, consultations, and design we’ve gotten started. We’re working with staff to identify relevant reports with open data in them, and (where possible) working with them to publish or update open datasets. This makes it easier for us to publish the impactful data that city council is paying attention to.
We published how data owners outside the City bureaucracy can publish their data on open.toronto.ca; in short – it requires working with us and another division within the City.
We also published a page to make it easier (and way more transparent) to make a request for new data on our portal. These requests are publicly visible, and can be liked and commented on by other users (without needing an account or login).

The platform we’re using is new, and admittedly disjointed from our requests section (which shows which requests we’re working on, not necessarily all the ones that have ever been requested). We’re considering ways we can make the experience a bit better.
Community Engagement
Engagement
We got involved in the community a few ways the last few months.
We started running monthly open data jam sessions (we’ve done 3 since January), where we connect with different kinds of users of open.toronto.ca, listen to how they use the data and what pain points they have. This is important for us; we don’t require user accounts on the open data portal, so we don’t have any strong way to track who is using our data and what problems they might be experiencing.
Of course, there were the 2025 Open Data Awards. We filled up Metro Hall Rotunda with just under 100 people, including City Councillors Paul Ainslie and Jamaal Myers, and celebrated 9 different significant uses of Toronto’s open data from the year. More on the competition and the winners on our blog, here.
We also went to York University to help students visualize some open data, hosted an AMA on reddit and were not chewed out too hard, and attended Civic Tech Toronto hacknights a few times to talk with users about a few things.


Social Media
Only recently did we start posting on LinkedIn and BlueSky (in addition to Twitter). For the curious, some numbers on the growth of all that are below.
| Metric | January | February | March |
| Social Media New Followers | 90 | 170 | 196 |
| Social Media Impressions | 8,947 | 14,013 | 22,246 |
| Social Media Engagement Rates | 9.05% | 11.69% | 7.65% |
| Post Shares | 9 | 13 | 36 |
| Post link clicks | 621 | 1715 | 1280 |
| Blog Posts | 2 | 2 | 3 |
Spotlight and Insights
The winner of our Open Data Awards wrote an algorithm based on GTFS-RT to detect bus bunching; when 2 or more TTC buses arrive at a stop close together and leads to delays.
A recent TTC CEO’s report highlights work that the TTC is already doing to address issues that are called out in work like this relating to bunching.
What’s next?
Over the next 3 months, we’re going to try to make improvements to a few things:
- We’re making it easier to make requests for new/upgraded open datasets by upgrading our portal’s requests section
- We’re making it easier to know what we’re up to by launching a quarterly newsletter (whether it’s an upgrade to the layout of these quarterly blogs or something else, we’re not sure)
- We’re making it easier to navigate projects that use Toronto Open Data, like in our portal’s gallery section