Blog article: Portal Analytics

Article text
As members of the Open Data Team, we were thrilled to dive into our own dataset and analyze the numbers to gain insights about our own portal’s performance and impact. The process was enlightening, and we were eager to share our findings with others.
To shed light on our journey of self-discovery, we interviewed Reza Ghasemzadeh, a technical expert on our team who led the analysis. Our conversation delved into the details of his analysis, revealing key findings and insights that we believe will be valuable when working with this dataset. Let’s first define some terms before jumping in:
- A session is a set of interactions from a single identified user in a given time frame to each page.
- A visit refers to a single instance of a user accessing a webpage
- Download refers to clicking on the “Download” button on our dataset page
- A dataset (dataset package) is a collection of structured or unstructured data
- A file is a collection of information or data that is typically characterized by a specific format (ex. csv, xlsx, etc)
- Dataset visits are analyzed for the entire year while the dataset downloads are analyzed from March to December of 2022 (due to the system not tracking any data from January and February of 2022).
- At the time of analysis, we assumed the City had 41 divisions; however, we confirmed the City has 44 divisions, some which were added in 2022. We used the number 41 because at that time it represented the number of different Publishers/Divisions we had in the open data portal.
- Civic issues are based on datasets that have been #tagged with a civic issue. Datasets that are not tagged will not be part of this analysis.
- The data is available for you to analyze here: Open Data Web Analytics – City of Toronto Open Data Portal
Top 10 Divisional Datasets visits
The City has 41 divisions (not including Agencies, Boards & Corporations). Some have plenty of datasets; other divisions don’t have as much. Our first exercise involved examining the traffic and engagement patterns of different datasets across the various divisions that publish data throughout the portal.
The total number of dataset visits on our portal was 174,593 sessions in 2022. To put this into perspective, we hosted around 500 dataset visitors, on average, every day in 2022.
This analysis helped us answer questions such as, “which divisions attract the most traffic?” The following table displays the most popular divisions based on the sum of dataset visits (sorted by total sessions) in 2022:
| Owner division | Sessions total | Sessions share pct |
|---|---|---|
| Transportation Services | 19888 | 11.39 |
| Social Development, Finance & Administration | 19631 | 11.24 |
| Toronto Public Health | 16405 | 9.4 |
| City Planning | 13498 | 7.73 |
| Information & Technology | 13210 | 7.57 |
| Municipal Licensing & Standards | 12788 | 7.32 |
| City Clerk’s Office | 11848 | 6.79 |
| Toronto Police Services | 11019 | 6.31 |
| Shelter, Support & Housing Administration | 9302 | 5.33 |
| Parks, Forestry & Recreation | 8314 | 4.76 |
The sessions share percentage (pct) is simply derived by dividing the divisional value by total value. This is done to make sense of the numbers.
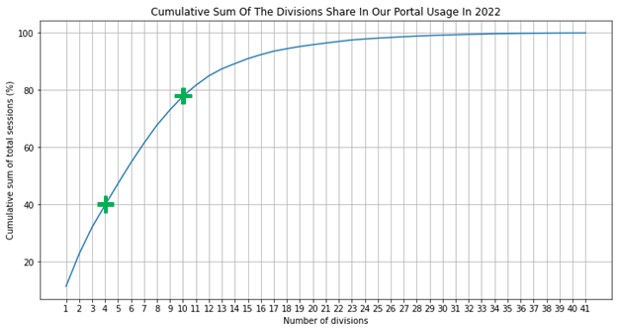
Reza thought it would be interesting to create a cumulative sum plot of these shared percentages, after sorting them from highest to lowest. To do so, he took the highest share percentage (11.39%) as the first point (X=1) in our plot. So, the first point has x=1 and y1=11.39%. For the second data point (X=2), he added the second highest share percentage (11.24%) to all the values bigger to it. So, y2=11.39+11.24=22.63%. He continued this until he exhausted all 41 division rows.
The resulting graph presented below, shows us that the top 4 divisions (out of 41) are responsible for 40% of visits; the top 10 divisions attract nearly 80% of our portal dataset visit traffic in terms of total number of sessions.
Analyzing this data provided us with some insights into which datasets are most popular or useful for different groups of users, as well as identifying potential areas for improvement or further development, which led us to our next analysis.
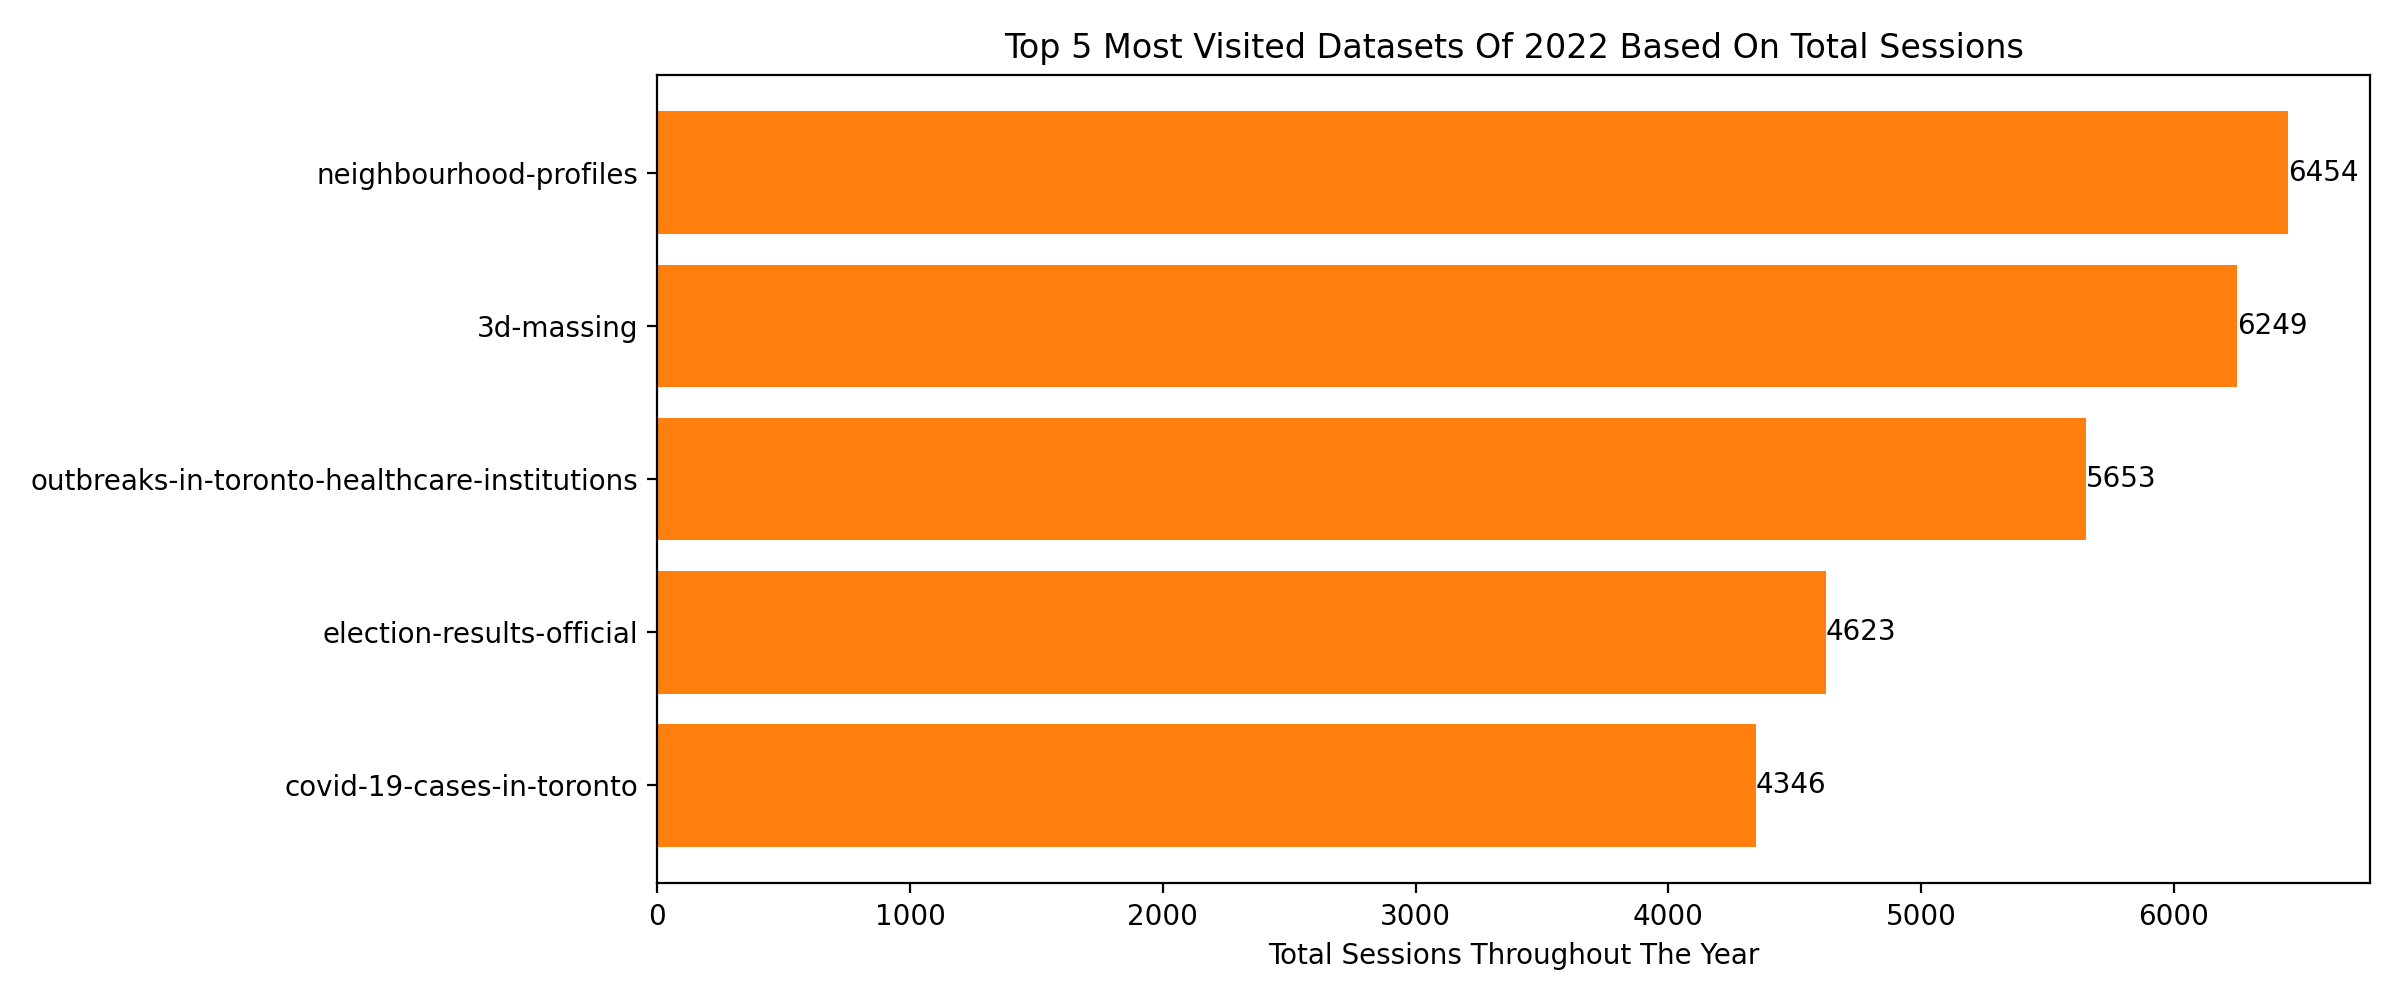
Top 5 most visited dataset packages
We then asked, which datasets/packages are the most frequently accessed, what types of data are most popular, and which areas of interest are most represented among users? Analyzing the top 5 most visited dataset packages on the open data portal provides valuable insights for optimizing the user experience, as well as informing strategic decision-making around resource allocation.
Currently we are hosting more than 430 dataset packages on our portal.
It was interesting to find that the top dataset package visited – Neighbourhood Profiles – did not correlate to the top division visited – which was Transportation Services, as seen in the above analysis of Top divisional dataset visits.
The top visited datasets were the following:
Neighbourhood profiles – The Neighbourhood Profiles provide a portrait of the demographic, social and economic characteristics of the people and households in each City of Toronto neighbourhood. The data is based on tabulations of 2016 Census of Population data from Statistics Canada.
3d Massing – This is a geospatial 3D ESRI shape / 3D CAD format file of building shapes for City of Toronto
Outbreaks in Toronto Healthcare Institutions – This dataset includes list of outbreaks in Toronto healthcare institutions – including hospitals, long-term care homes, and retirement homes – which are currently active, those that have been declared over for the current calendar year. Year-to-date data for the current year are updated weekly, each Thursday.
Identifying Trends Across Datasets
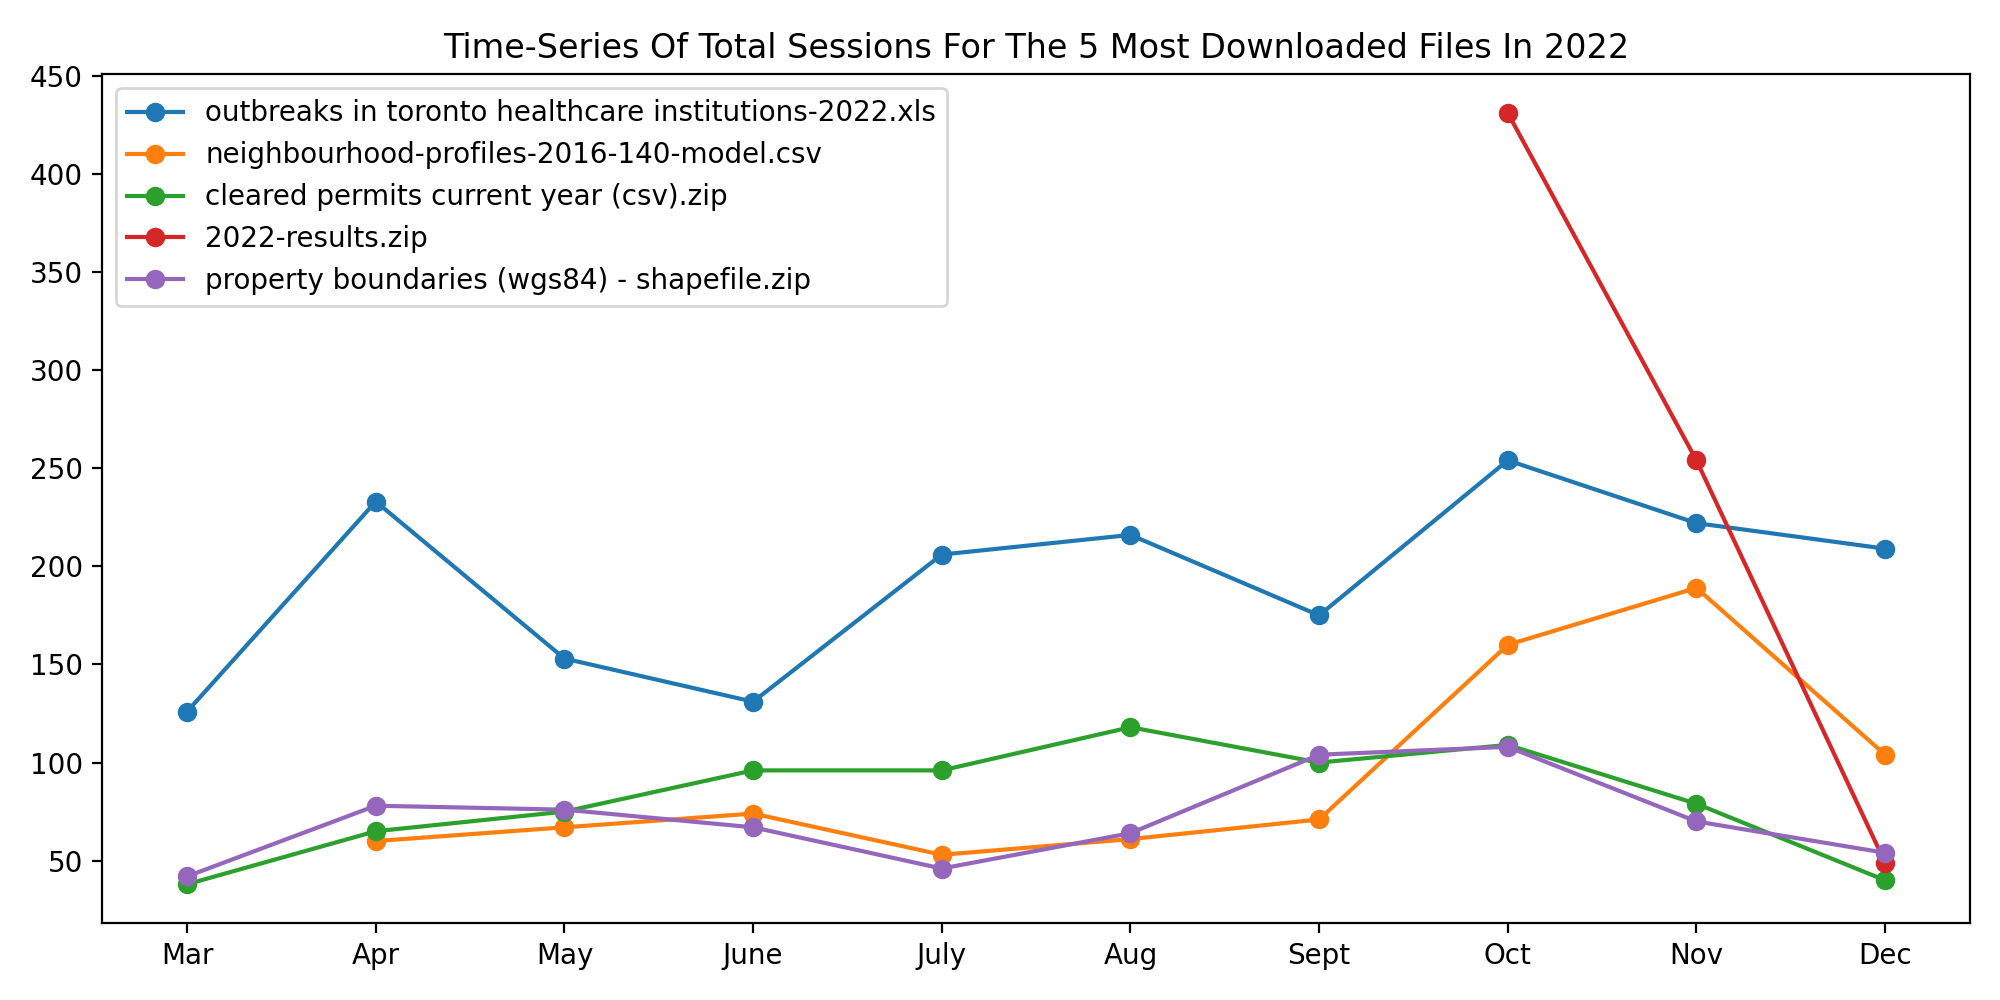
We also analyzed the trendline of the top 5 most visited datasets of 2022 based on session count. We observed that Outbreaks in Toronto’s Healthcare Institutions was particularly popular in January, which coincided with the peak of cold and flu season. Additionally, Elections saw a surge in views in October, aligning with the timing of the fall 2022 elections. Interestingly, 3D massing maintained consistently high levels of views throughout the year, suggesting a high level of interest among urban planners, architects, real estate developers, and geospatial analysts.
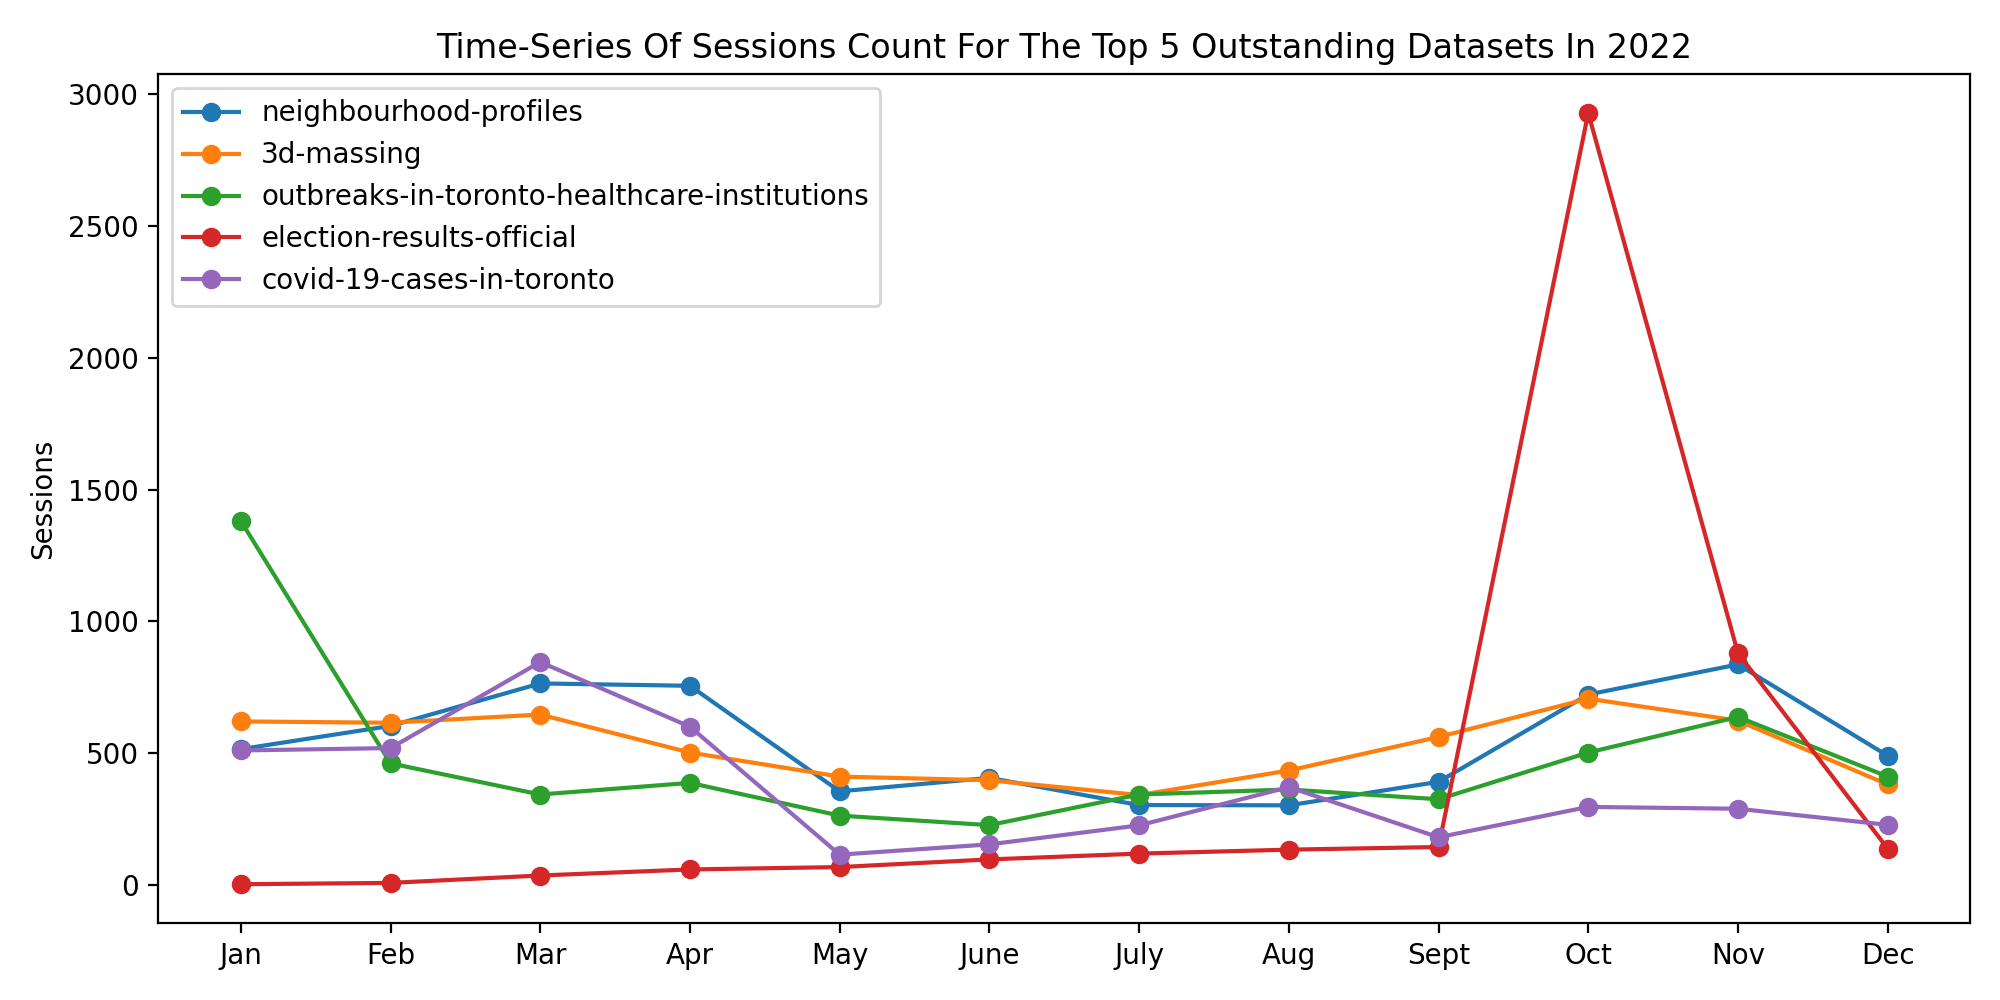
From the above plot, we could also identify potential trends or patterns in user behavior, such as whether certain datasets are more likely to be accessed during certain times of the year.
Top 5 most downloaded datasets
As we delved into the realm of data analytics, it was intriguing to explore the trends in dataset downloads. The accompanying bar plot represents the total number of downloads for each available file within a dataset, highlighting the five most frequently downloaded datasets in 2022. A noteworthy observation is that while some datasets (dataset pages) may have high “visits,” the most downloaded datasets may differ significantly, as evidenced by the inclusion of only two datasets, “outbreaks in Toronto healthcare institutions” and “neighbourhood profiles,” in the top five downloaded datasets.
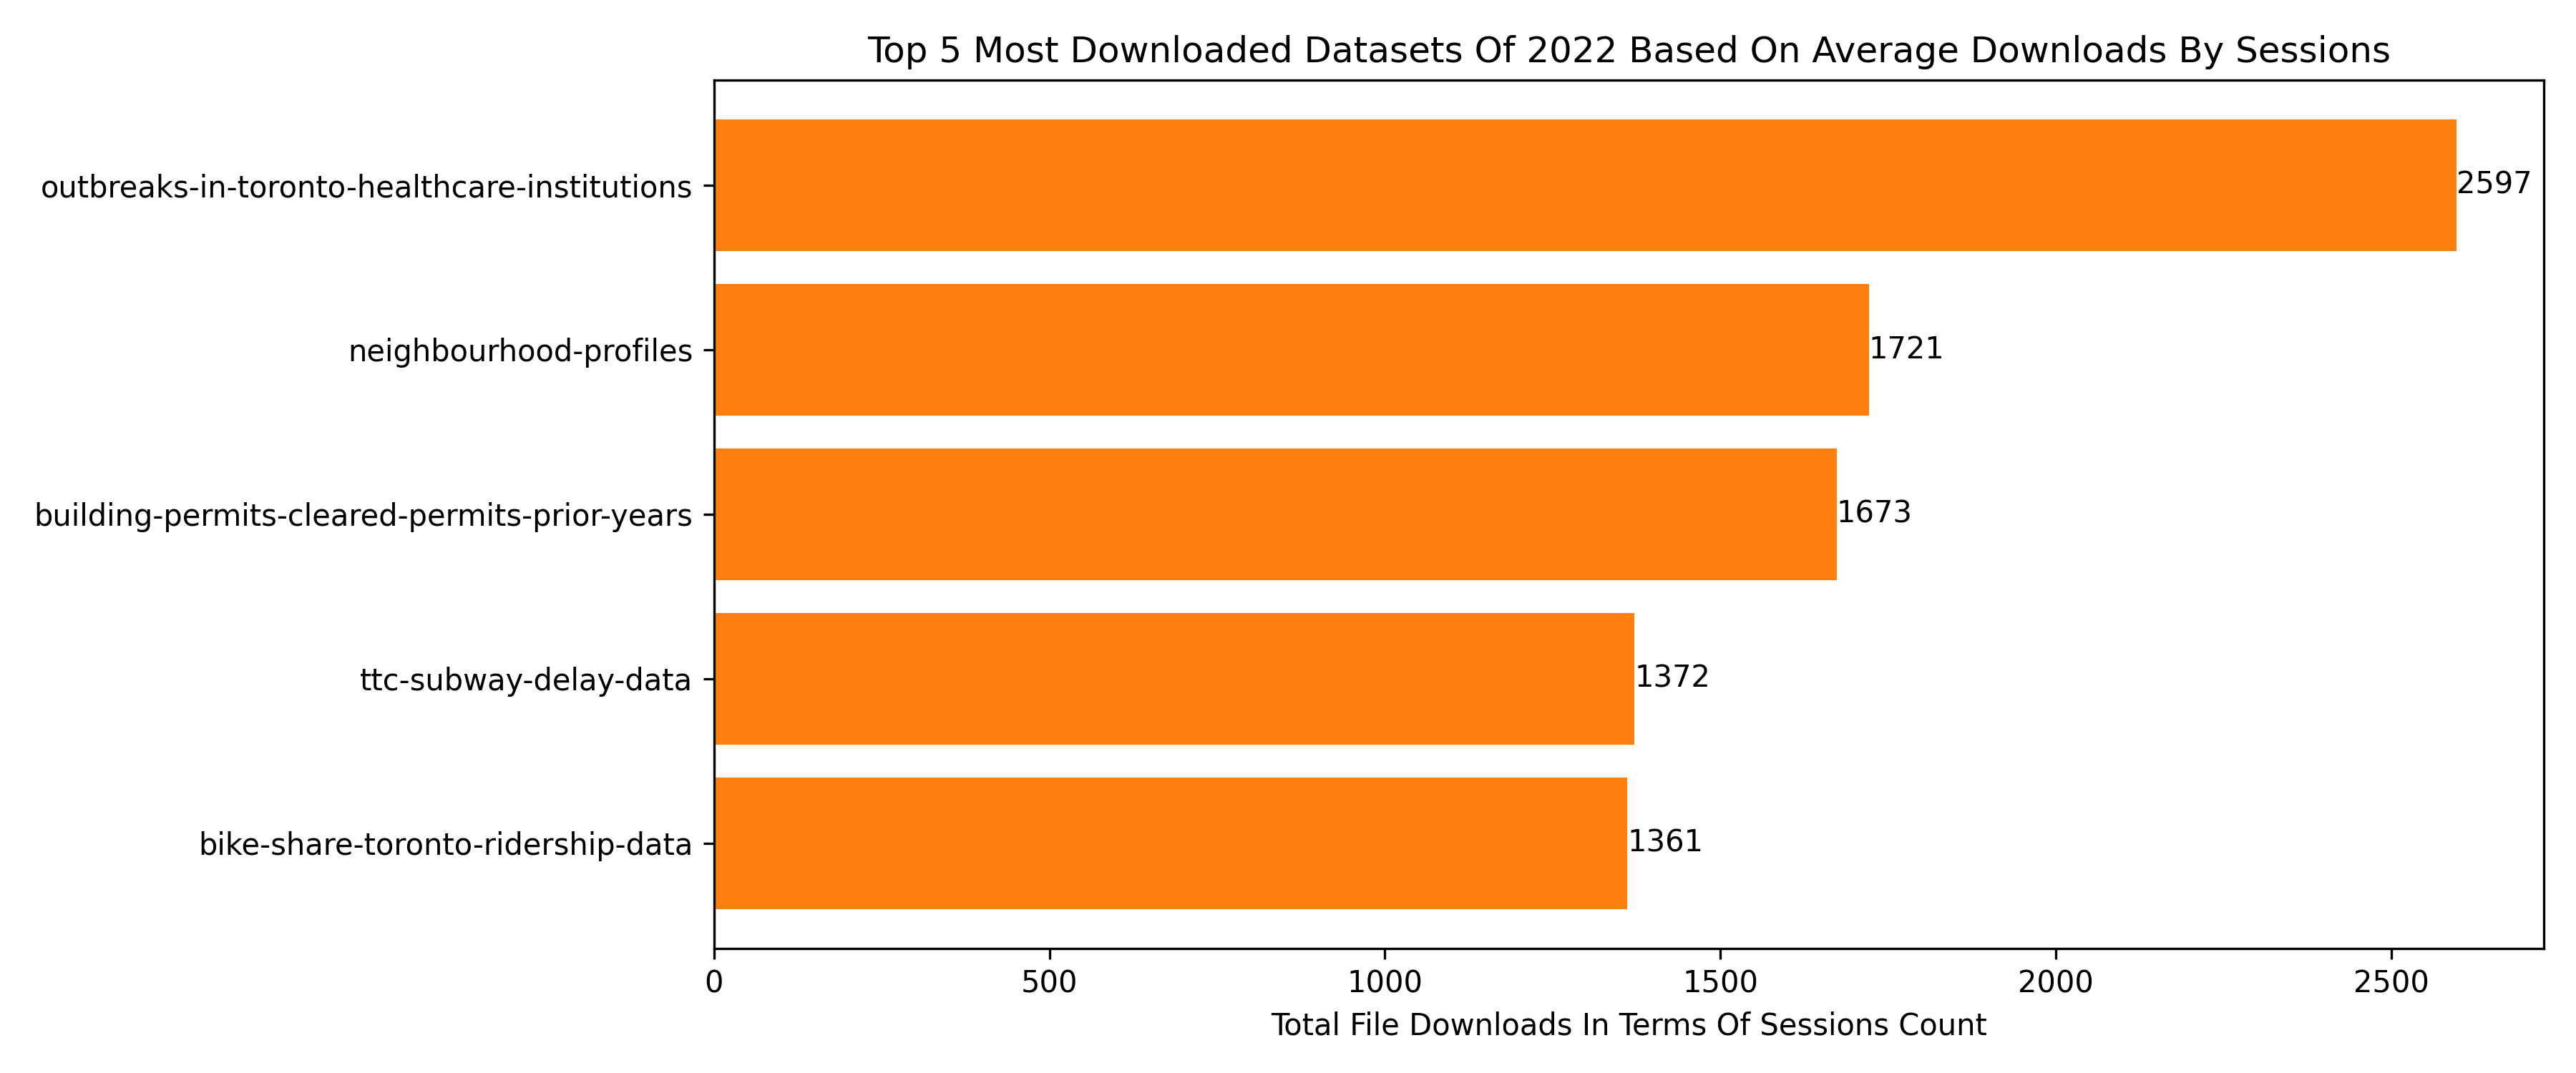
Top 5 most downloaded files
This analysis helped us understand which files are the most popular, what types of data are in high demand, and which areas of interest are most represented among users. It could also help identify areas for potential improvements, such as improving the accessibility or usability of certain files.
Outbreaks in Toronto Healthcare Institutions was by far the most accessed dataset file in 2022, more likely because of the surge of the COVID virus.
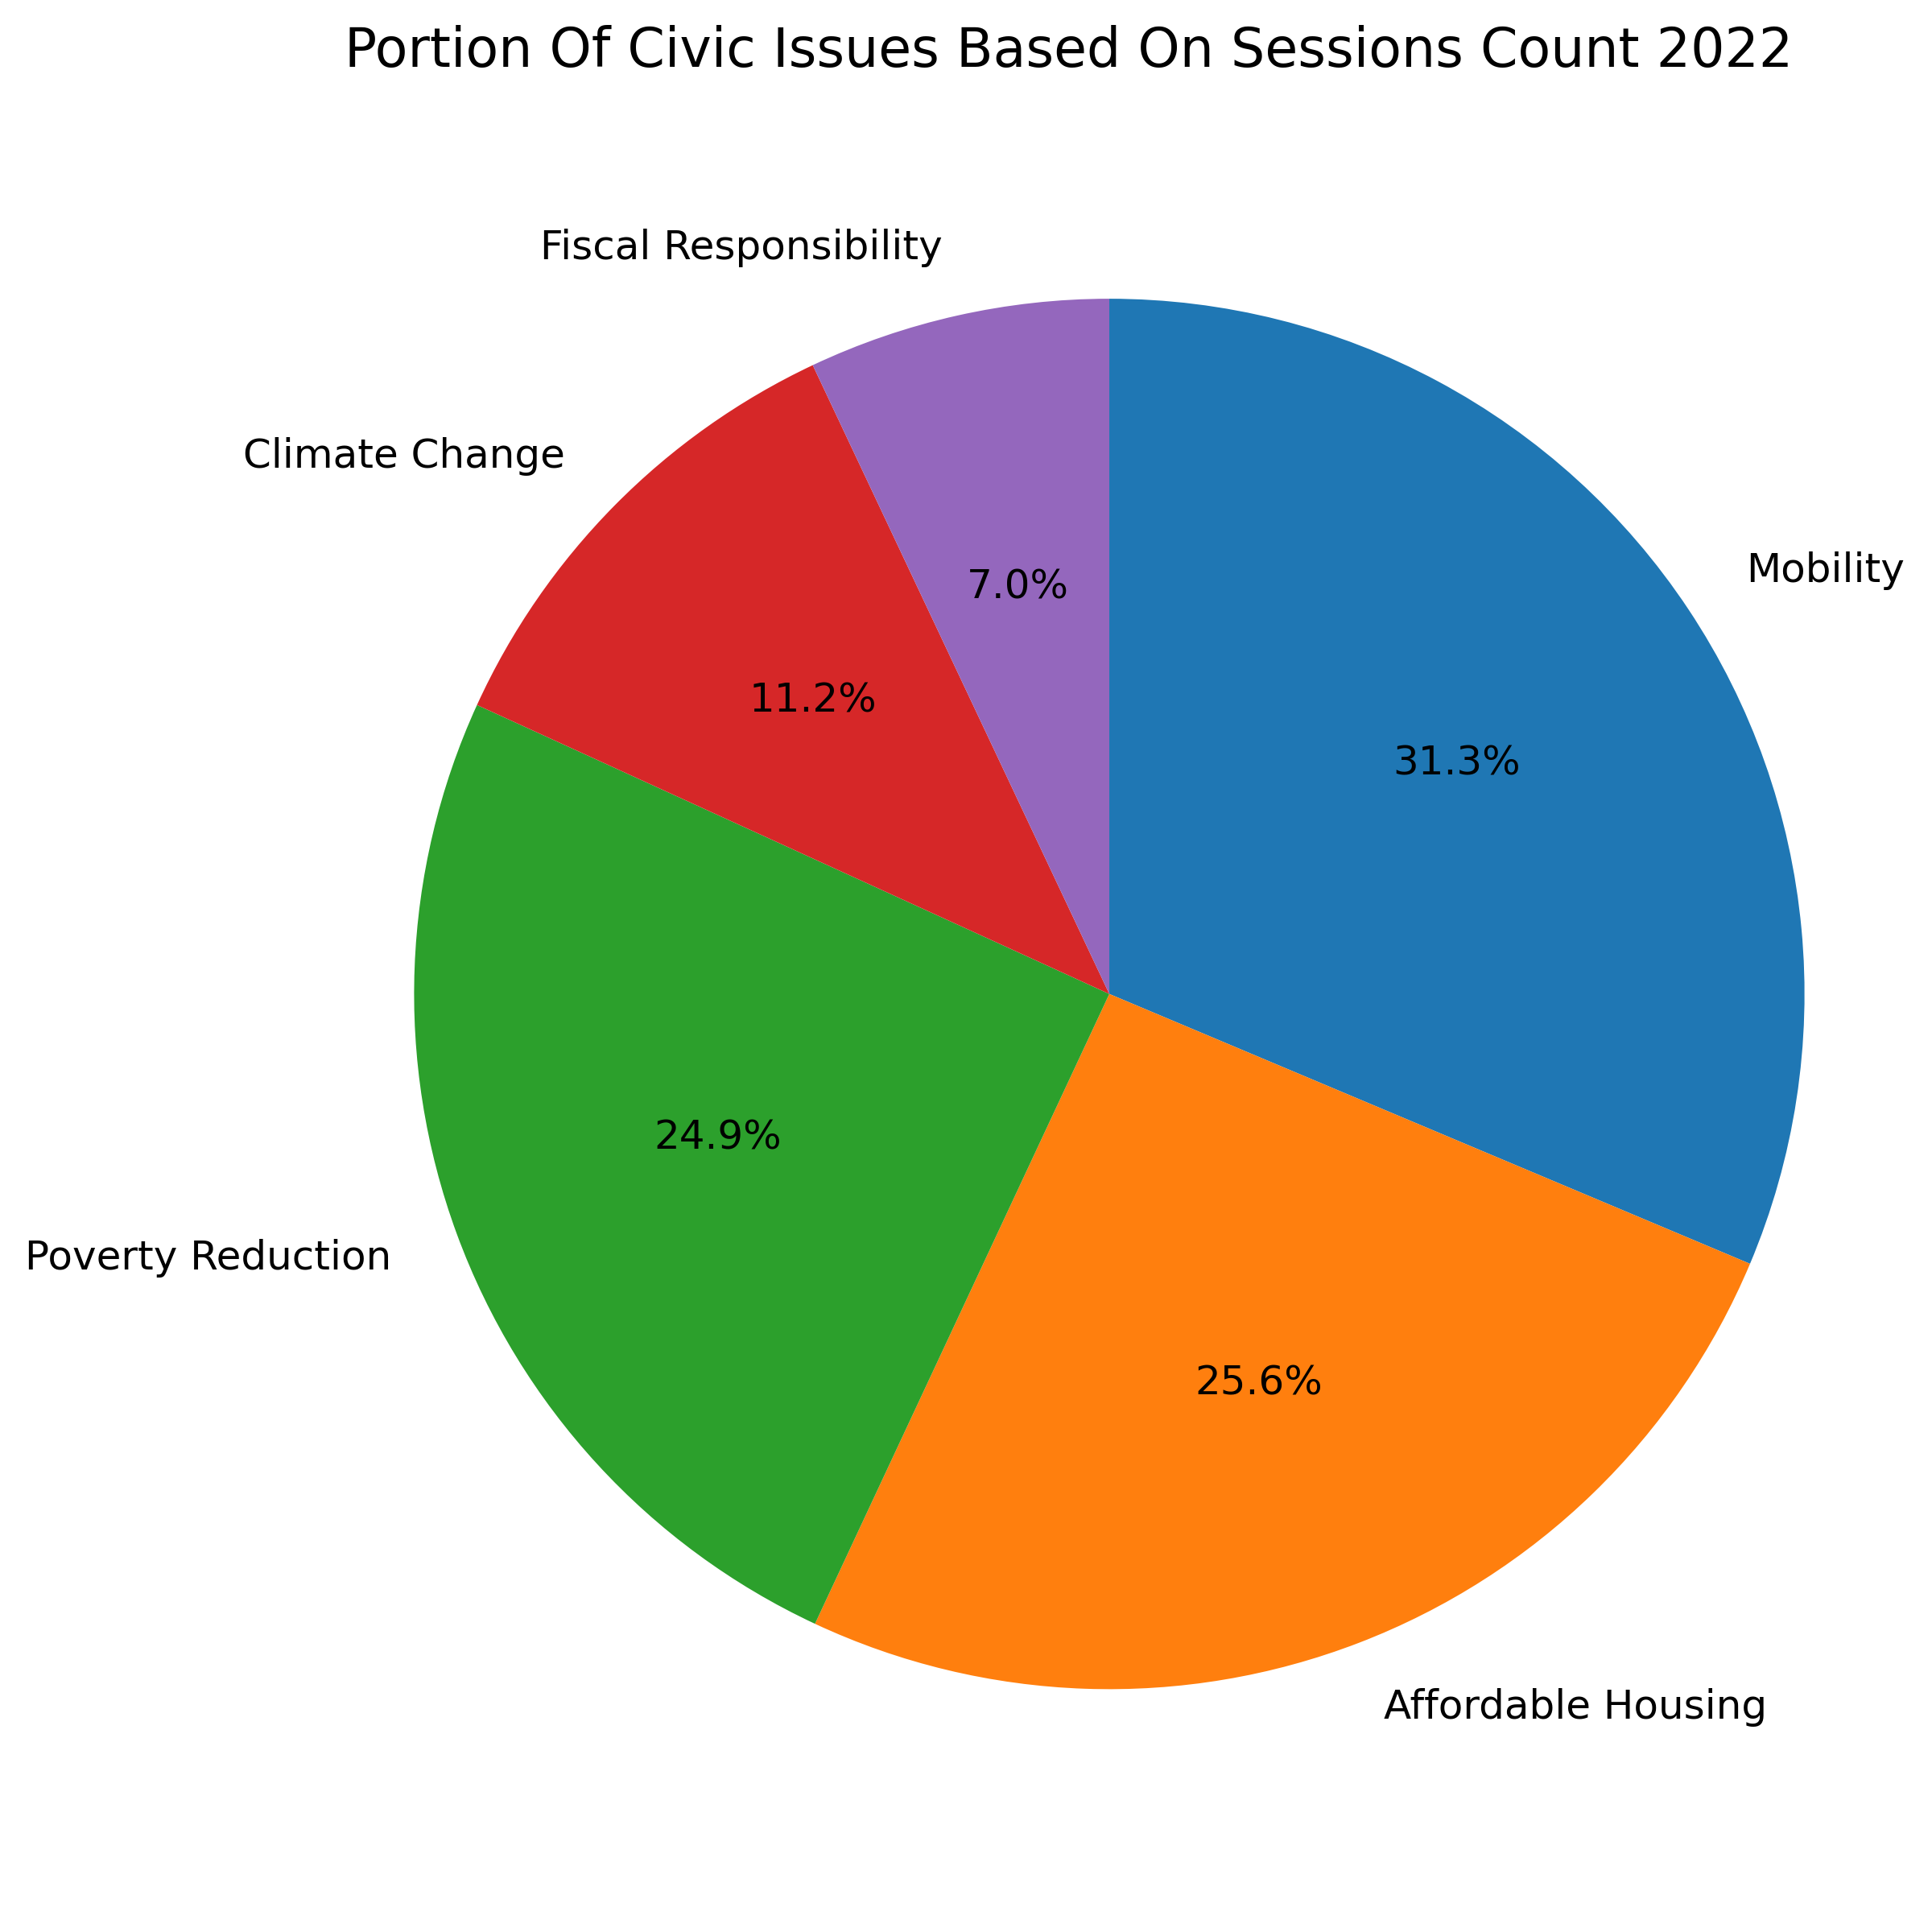
Civic issues people are most concerned about
The Civic Issue Campaign aimed to prioritize the release of datasets based on five key civic issues: affordable housing, poverty reduction, fiscal responsibility, climate change, and mobility. These issues were identified through a combination of strategic priorities for the city. We’ve written previously about them and our civic issues campaign. The campaign considered the impact of these issues to determine which datasets to release next.
According to the available data and related tags, it appears that certain civic issues are of greater interest to people than others. These issues have been ranked based on the number of times they were visited, with Mobility being the most popular, followed closely by Affordable Housing, Poverty Reduction, Climate Change, and finally Fiscal Responsibility.
There are a few possible reasons why Mobility is the most searched civic issue. One reason could be that Toronto is a large and densely populated city, which often leads to traffic and transportation being major concerns for residents. Another explanation may be that the Transportation Services division was the most visited divisional data on the portal, which suggests that people are particularly interested in issues related to transportation in Toronto.
(Keep in mind not every dataset is associated with a civic issue tag and therefore this is only a count from 189 out of 443 datasets, that’s 42% of the entire catalogue as of when this blog was written).
Based on the insights and findings shared in this blog post, what are some potential actions or use cases that you can think of for these analytics? How might this information be helpful to you or your organization? We’re always happy to collaborate.