Blog article: Guest Post: Using Folium to Visualize Distribution of Public Services in 140 Toronto Neighbourhoods
Article text
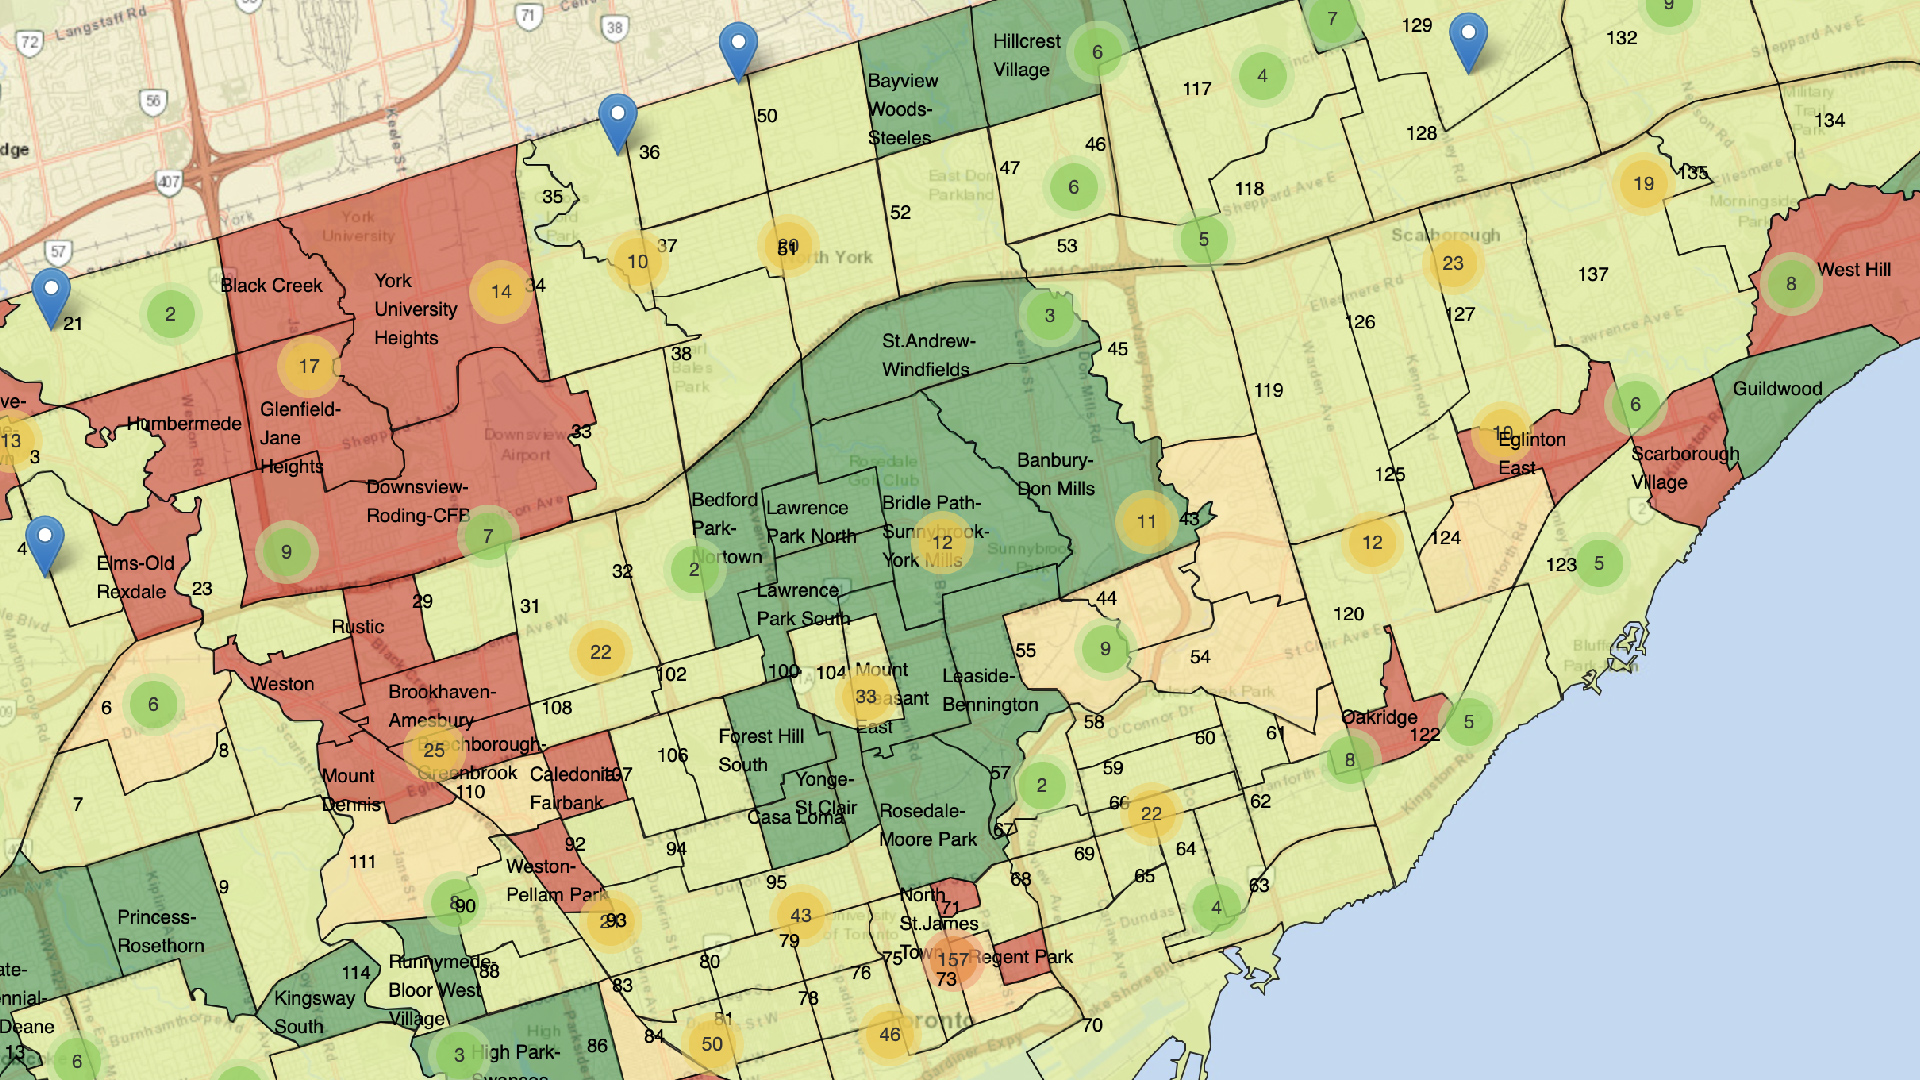
Lisa Chen reached out to the open data team with the visualizations she created from two open datasets: Toronto Neighbourhood Boundaries and Youth Wellness Resources. We really enjoyed Lisa’s data story which guides users through visualizing the data using a library called Folium. We’ll let Lisa take you through the rest in “Using Folium to Visualize Distribution of Public Services in 140 Toronto Neighbourhoods.” Read article on Medium
About the author
Lisa graduated from the University of Toronto with a degree in History and Computer Science, and she currently works at a Home Management Startup in Toronto as a Data Insights Strategist. Lisa is passionate about using data to tell stories and derive compelling insights that will hopefully improve our lives and organizations. She believes that coding is the ultimate super power of the 21st century. In her spare time, Lisa enjoys travelling to far off regions of the world, hiking, and reading biographies.
Find Lisa on LinkedIn.