Blog article: Decoding Transit Delays: A Data-Driven Dive into the Toronto Transit Commission (2014-2022)

Article text
We are delighted to welcome Ehsan Kaviani, a seasoned data analyst, as our next guest blogger. Kaviani offers a deep-dive into the Toronto Transit Commission (TTC) public transportation system. His comprehensive data analytics report scrutinizes subway, streetcar, and bus delay times from 2014 to 2022. Through a series of data visualizations, Kaviani identifies significant factors influencing delay times and provides insightful recommendations for enhancing service quality. Enjoy reading through his analysis, as he explores TTC’s operations and the power of data analytics in driving urban efficiency. Get in touch with Ehsan: https://www.linkedin.com/in/ehsankaviani/ and as always, if you have a powerful story to tell through your data analysis, we’d love to feature your story.
Toronto Transit Commission (TTC) – Subway, Streetcar, and Bus Delay Time Data Analytics Report from 2014-2022 – written by Ehsan Kaviani
The Toronto Transit Commission (TTC) is a government organization that offers public transportation to approximately 1.7 million people who commute daily in Toronto and the neighboring areas. The main goal of the TTC is to create, manage, and sustain the public transportation system for passengers in Toronto, which is the most extensive public transit system in Canada and ranks third in North America. The TTC delivers its services through the immense subway, streetcar, and bus network. It also manages parking lots at its subway stations.
Background
We are living in the data era. Today, data is an asset to humans to improve all daily tasks and operations. Data analysis has significantly improved transportation and navigation systems. For instance, it helps optimize traffic flow, predict congestion, and suggest alternate routes to reduce travel time. GPS navigation systems analyze real-time traffic data to provide accurate directions and estimated arrival times, assisting users in planning their journeys more efficiently.
There is no doubt that public transportation is one of the most crucial elements for running the city. Billions of passengers use the urban transit system yearly to reach their desired destinations worldwide. Various methods provide these facilities, including buses, streetcars, subways, etc. New York, Shang Hai, Paris, London, Berlin, Tokyo, Hong Kong, Madrid, Seoul, and Toronto are the most famous big cities in the world that use wide public transportation systems with thousands of kilometers of system length on the streets and underground.
Due to the large and extended systems, and the vast number of individuals who use these vehicles, many factors would impact the quality of service. One of the most important key performance indicators for evaluating the quality of operations is the schedule delay. There are many reasons for delays in public transportation systems. At a glance, these reasons would be categorized as human factors or technical factors.
Consequently, to reduce the delay time and enhance the service quality, authorities, and executives managers can recognize the most prevalent factors when delay incidents are most likely to occur and for how long. Therefore, they will be able to find impactful solutions with data analysis methods aiding them in identifying areas for improvement and ultimately enhancing their service.
Define Research Questions
By using Toronto Transit Commission (TTC) data provided by Toronto City’s Open Data Portal, this report investigates the delay and gap time status for the subway, streetcar, and bus between 2014 to 2022 in Toronto.
The report aims to identify:
- What were the transit method’s most delayed routes, directions, and bounds?
- When did the highest and lowest delays occur on day and night?
- How much is the rate of gap time by delay time for each transit method?
- What were the most prevalent delay reasons for buses, streetcars, and subways?
- How much were the total hours and minutes of delay and gap time for all transit methods individually and totally?
About the Data
The data provider has supplied the raw data with more than one million rows and various columns as MS Excel files. As the metadata tables, tables 1, 2, and 3 demonstrated each column’s descriptions for subway, streetcar, and bus delay time, respectively.
| Column name | Description |
|---|---|
| Date | Date (YYYY/MM/DD) |
| Time | Time Time (24h clock) |
| Day | Day Name of the day of the week |
| Station | Station TTC subway station name |
| Code | Code TTC delay code |
| Min Delay | Min Delay Delay (in minutes) to subway service |
| Min Gap | Min Gap Time length (in minutes) between trains |
| Bound | Bound The direction of the train depends on the line. |
| Line | Line TTC subway line, i.e., YU, BD, SHP, and SRT |
| Vehicle | Vehicle TTC train number |
| Column Name | Description |
|---|---|
| Report Date | The date (YYYY/MM/DD) when the delay-causing incident occurred |
| Route | The number of the streetcar route |
| Time | The time (hh:mm:ss AM/PM) when the delay-causing incident occurred |
| Day | The name of the day |
| Location | The location of the delay-causing incident |
| Incident | The description of the delay-causing incident |
| Min Delay | The delay, in minutes, to the schedule for the following streetcar |
| Min Gap | The total scheduled time, in minutes, from the streetcar ahead of the following streetcar |
| Direction | The direction of the bus route where B,b, or BW indicates both ways. (On an east-west route, it includes both east and west) NB – northbound, SB – southbound, EB – eastbound, WB – westbound The direction is not case-sensitive. |
| Vehicle | Vehicle number |
| Column Name | Description |
|---|---|
| Report Date | The date (YYYY/MM/DD) when the delay-causing incident occurred |
| Route | The number of the bus route |
| Time | The time (hh:mm:ss AM/PM) when the delay-causing incident occurred |
| Day | The name of the day |
| Location | The location of the delay-causing incident |
| Incident | The description of the delay-causing incident |
| Min Delay | The delay, in minutes, to the schedule for the following bus |
| Min Gap | The total scheduled time, in minutes, from the bus ahead of the following bus |
| Direction | The direction of the bus route where B,b, or BW indicates both ways. (On an east-west route, it includes both east and west) NB – northbound, SB – southbound, EB – eastbound, WB – westbound The direction is not case-sensitive. |
| Vehicle | Vehicle number |
Prepare Data for Analysis
The raw data were provided separately in Excel files for each year from 2014 to 2022 for the delay time of buses, streetcars, and subways. Every Excel file has 12 sheets, including raw data for every month of the year from January to December. This model has been followed for all three vehicles to provide data.
After equalizing, spell-checking, and ensuring column names in all the Excel files, the sheets for every year were appended to each other by Power Query to generate a datamart for every vehicle’s data. Then, due to the columns’ values, the data type of every column was set at Power Query to ensure that columns contained the correct data types. Therefore, calculations could be performed on numerical fields and time intelligence operations on date and time fields.
Report Designing
The data provider has released the data of each transit method individually in different web links. The advantage of this report is to be comprehensive as it integrates all the TTC’s delay data in the same place. Consequently, a specific button has been assigned to reach the bus, streetcar, and subway report separately on the home page.
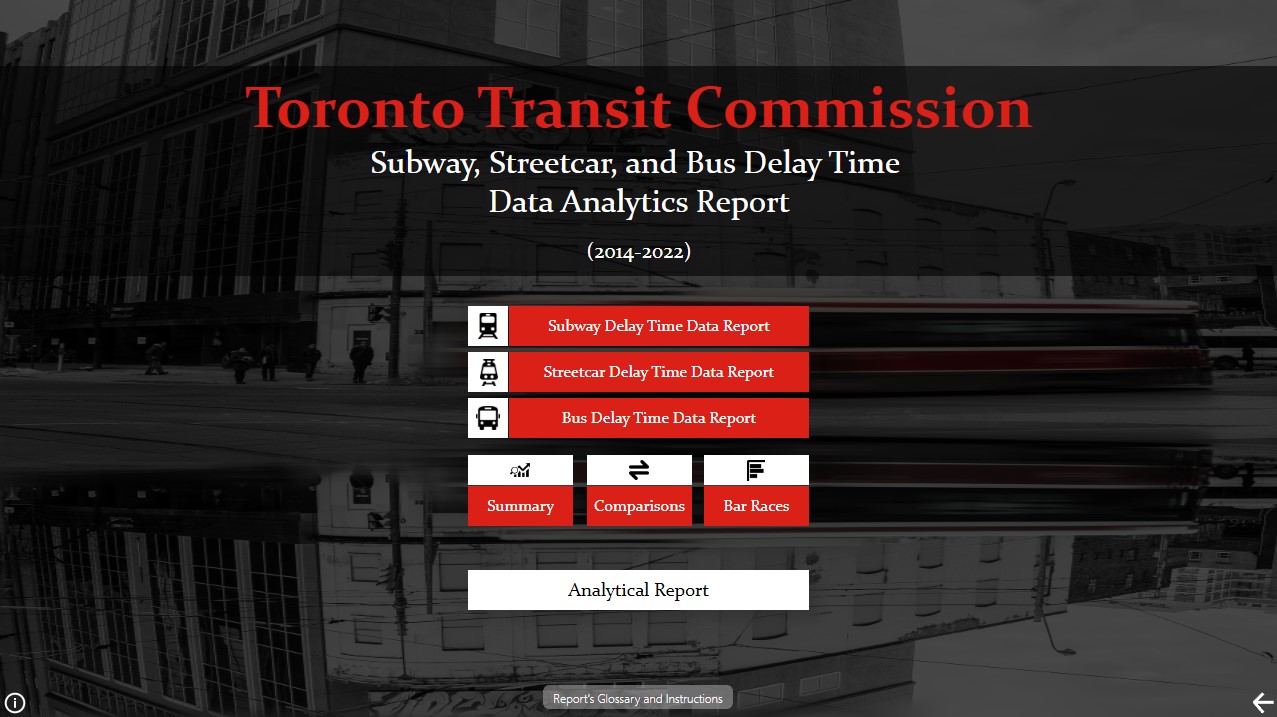
The report has three specific buttons: summary, comparisons, and bar races. The first one briefly describes the delay time across the TTC’s transportation system for the period mentioned. The second one demonstrates a comprehensive comparison of the three vehicles. And the third one is an animated bar chart that shows the changes in delay time from 2014 to 2022 for all three transit methods. Finally, there are buttons for the analytical report, glossary, instructions, and information regarding data sources, licenses, and attributions.
Data Visualization for Exploring
The following are screenshots of the dashboard regarding subway, streetcar, and bus delay time analytics with data filtering modules. Users can use the drill trough capability to filter the data by date, allowing them to filter it by date hierarchy, including years, quarters, months, days, and weekdays. Also, the direction/bound filter pane returns the results of a specific path. Holding the CTRL key lets you combine date elements and see mixed results.
The detailed information will be shown as a tooltip by hovering the mouse pointer on every visualization. Besides, all the related data will be filtered as an applied interaction by clicking on every part of visualizations, such as bar charts, pie charts, or line charts.
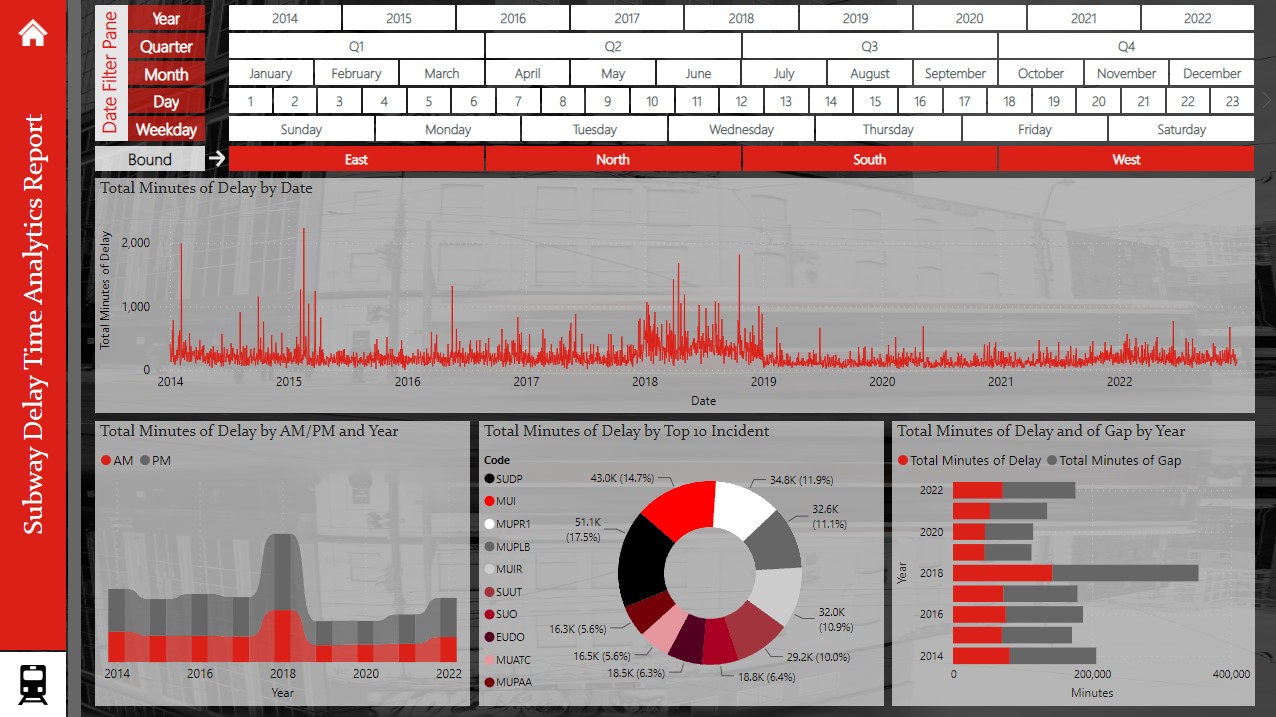
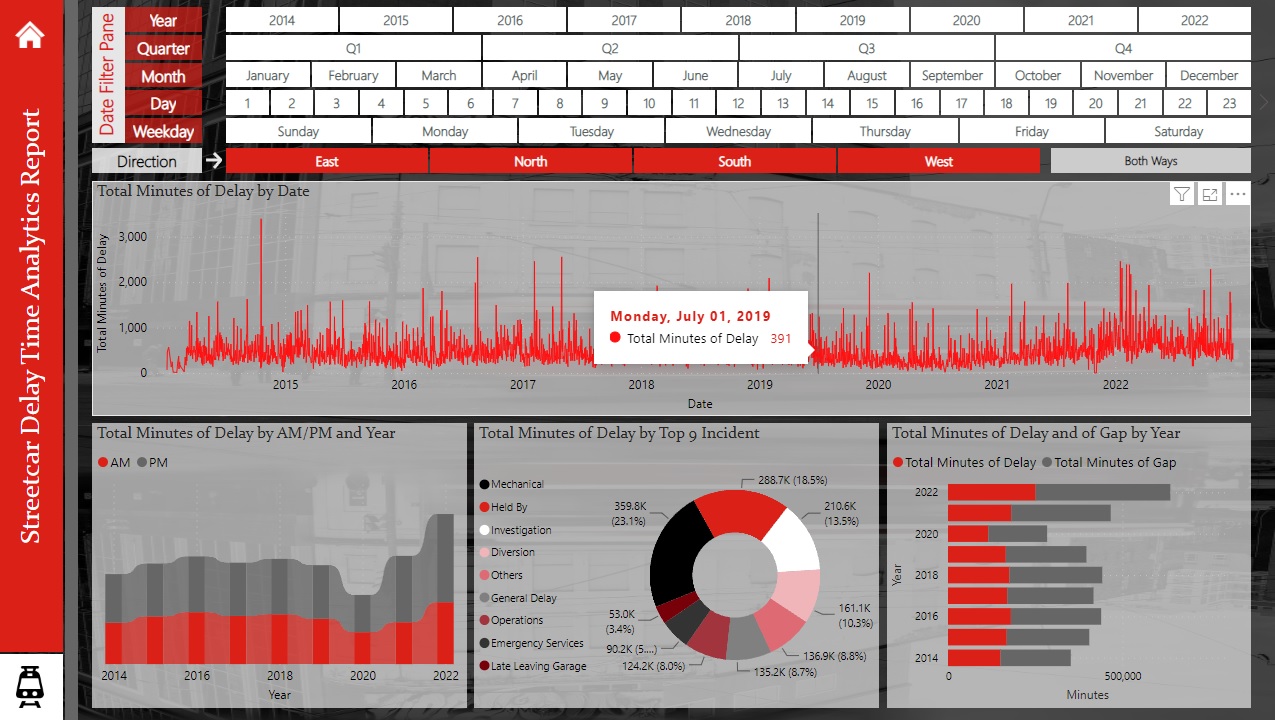
(The detailed information will be shown as a tooltip by hovering the mouse pointer on every visualization.)
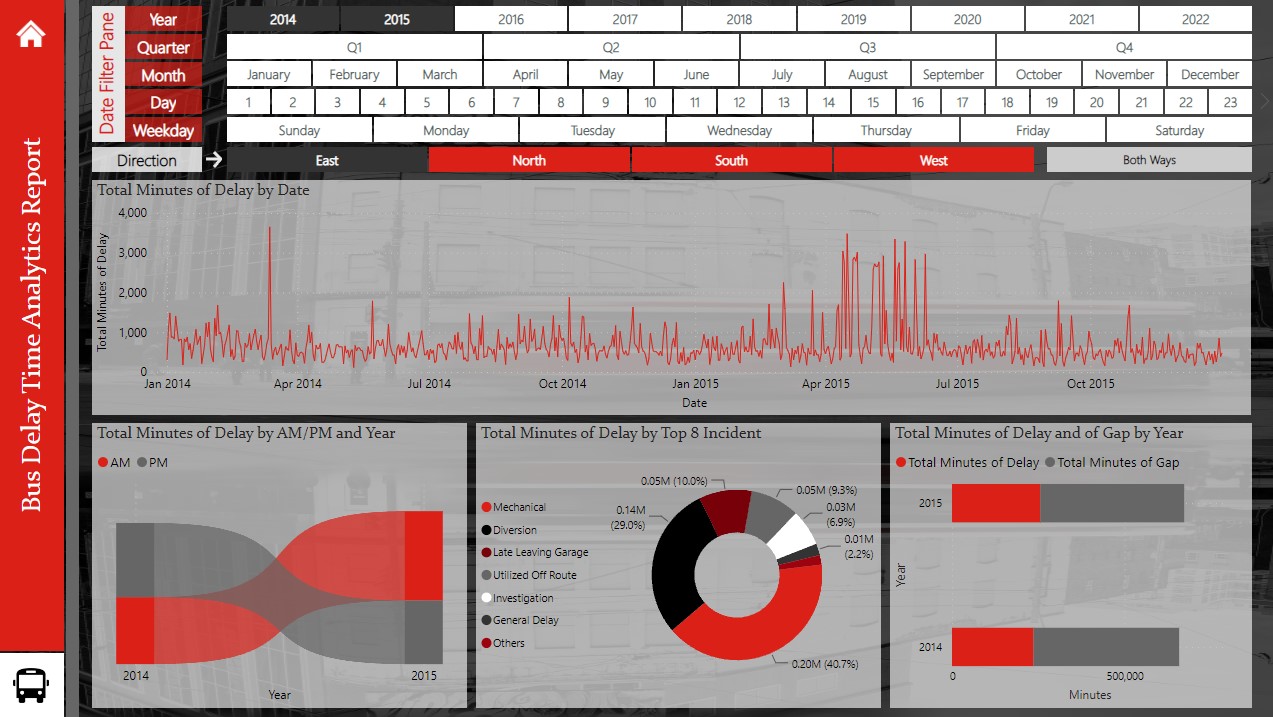
(holding the CTRL key combine date elements and see mixed results of 2014 and 2015 for the East direction)
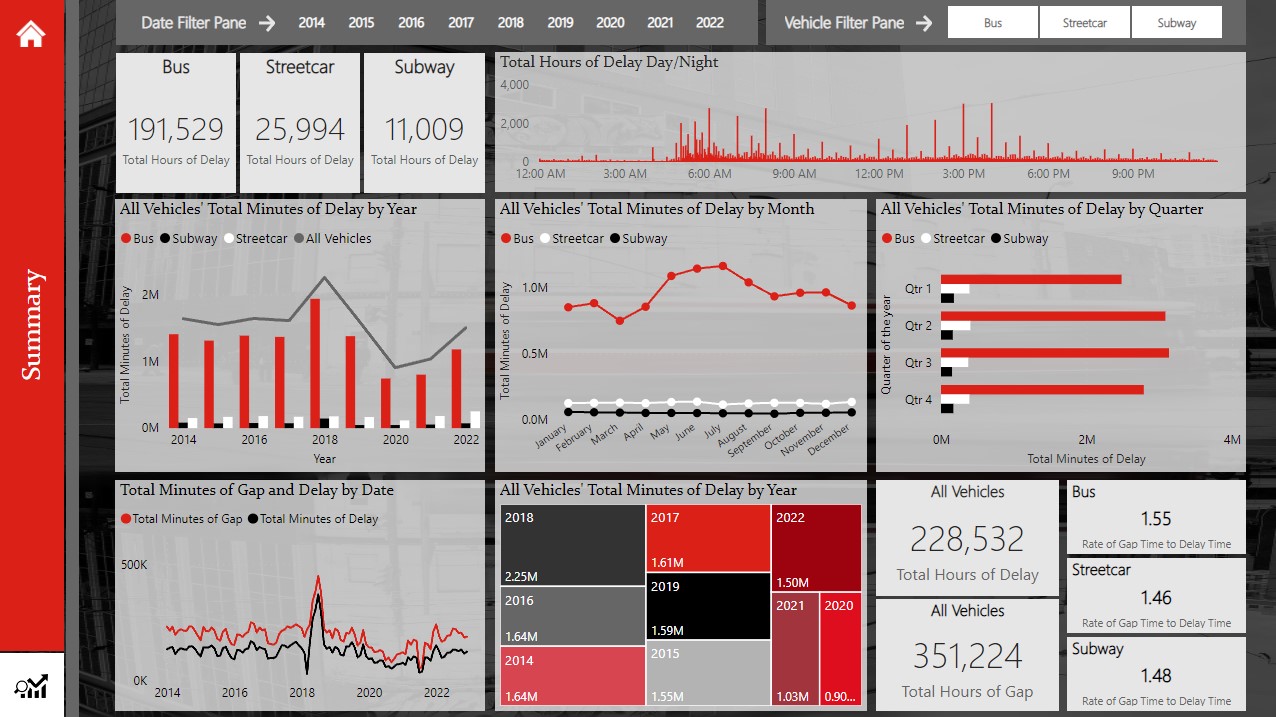
The summary page contains an abstract regarding delay data for years, quarters, and months that can be filtered by date and vehicles separately.
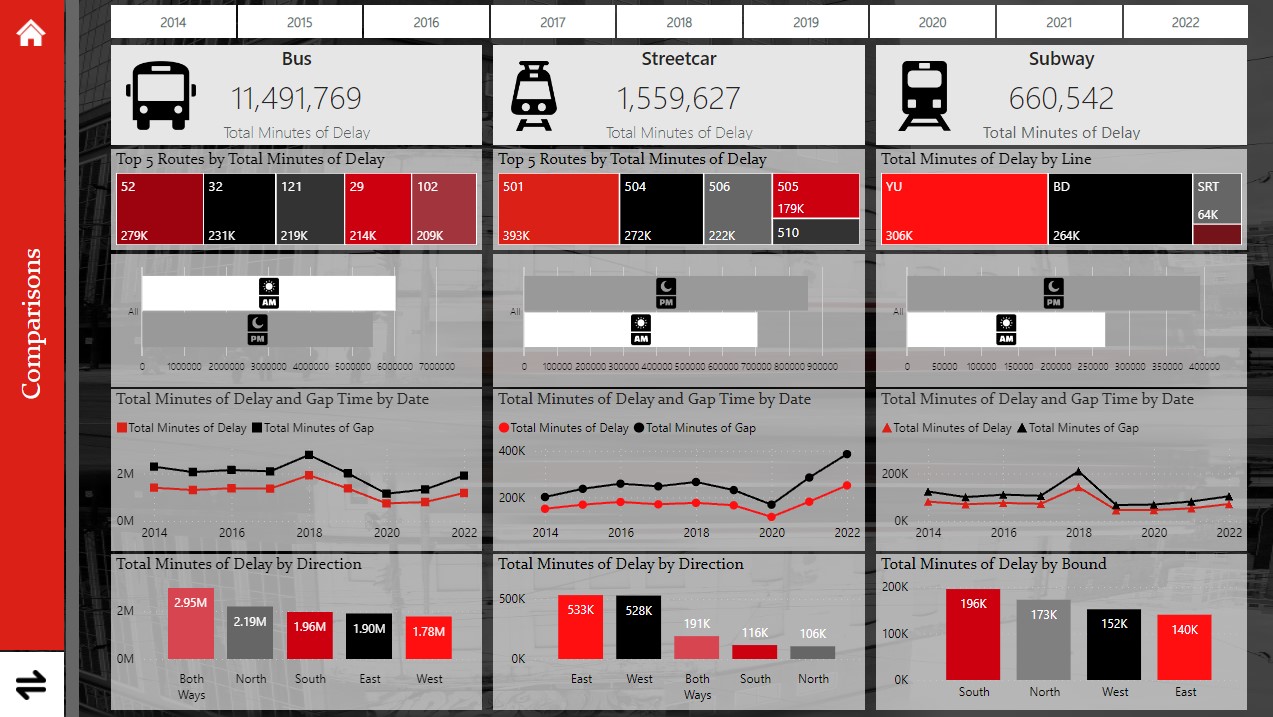
For the comparisons page, information on top delayed routes/bounds for each vehicle’s total minutes of delay and day/night delays was provided.
Analysis of Patterns and Trends
Data exploration offered several findings. Some of them contributed to answering research questions. Some other discoveries may not be directly connected to research questions but can be helpful. There are the answers to the research questions in the following:
- The analysis results investigate that the Southbound of the subway had been the most delayed route during the mentioned period, with nearly 30 percent compared to the other bounds. Also, with more than 35 percent in 2020, this bound had the most considerable portion of the delay time in the subway system. In addition, the east direction, with 36 percent, was the most delayed path for streetcars due to the vehicle’s direction. The delay time is 27 percent for both directions, including east-west or north-south for buses. Line 1, Yonge-University, was the most delayed in the subway system, with 46 percent. Route 501, with 27 percent, had got first place in delay time for the streetcar, and route 52 had the most share of delay time, with nearly 14 percent for buses.
- Generally, most delays occurred between 6:00 to 8:00 a.m. and 3:00 to 4:00 p.m. on average for the entire transit system. On the contrary, the transit system has a minimum delay between 3 a.m. and 4 a.m.
- The average rate of the gap time to delay time was approximately 1.5 for each vehicle.
- For the streetcar, mechanical problems, holding by, and investigation were the most important reasons for the delay respectively. Meanwhile, the pattern shows diversion, mechanical problems, and general delays as the main reason for buses. Besides, disorderly patrons, injured or ill customers on the train, fire and smoke, and train contact with persons were the leading causes of the delay time of the subway.
- Between 2014 to 2022, the total minutes of delay for all the transit methods were more than 13 million minutes. The share of bus, streetcar, and subway were 83.8, 11.4, and 4.8 percent, respectively. Also, 2018 had the most delay time for all the vehicles, with over 2.2 million minutes.
Tools, Visualization, and Datasets
| Tools | Visualizations | Datasets |
| Microsoft Power BI Desktop | Exploration Dashboard | TTC Subway Delay Data |
| Microsoft Power Query | TTC Streetcar Delay Data | |
| Microsoft Power BI Services | TTC Bus Delay Data |
Summary
In Toronto, with nearly 3 million population, TTC has a crucial role in public transportation. With its 24/7 operation hours throughout the year and approximately 1.7 million customer journeys on a typical weekday, the TTC has one of North America’s highest per-capita ridership rates.
Like every public transportation system in the world, due to the extent of the massive network and the vast number of daily customers, and considering the unpredictable delay incidents, it is pretty normal to have delay time for the TTC’s services. However, with a similar analysis to this report, the areas that increase delay time would be identified to improve and enhance services thanks to the data generated by the navigation systems.
Future Ideas
This report aims to investigate the delay time of TTC. With the comprehensive approach, it tried to inquire about the main reasons for the delay and its impact. Meanwhile, this analysis can undoubtedly be improved and derived in many directions, and joining this data with other related datasets would lead to new opportunities for impressive insights.
For the next analysis phase, generating predictions would be a worthwhile idea. With analysis of trends and patterns that occurred between 2014 to 2022, data analysts are able to make projections for the following years with the help of special tools based on machine learning algorithms with high accuracy. Besides, the other research questions can be defined for the target analysis due to the wide range of provided data. As an idea, what were the most delayed stations for all the vehicles?
Another idea is to produce an analysis of the other large cities in the world if the data is accessible. Indeed, the similarity of the transportation methods, the number of stations, the system length on streets and underground, the town’s population, the number of daily passengers, and various other factors would impact the results. Nevertheless, comparing each city’s results to the others, the rank of Toronto can be extracted from different cities worldwide regarding the delay time.
