Blog article: Analyzing results from the civic issues campaign survey
Published on March 3, 2020
Article text
Background: What is the civic issue campaign?
In 2019, the Open Data team launched a campaign in order to help us identify as well as prioritize the release of high-quality, in-demand data linked to the City’s 5 priority civic issues. By doing this, not only do we look to target the release of datasets that align to these issues, but we also want to understand how these datasets may help mitigate or solve these issues. The Mayor’s Office as well as the Open Data team have identified the 5 priority areas as: Affordable Housing, Poverty Reduction, Climate Change, Fiscal Responsibility and Mobility.
Together, these efforts align to our commitments outlined in Section 1b of our Open Data Master Plan.
Data Collection Methodology
Through the creation and distribution of a public questionnaire, we collected a total of 875 dataset requests, each of which indicates the type of data a respondent would like to see available, what civic issue(s) the dataset aligns to, as well as their specific output.
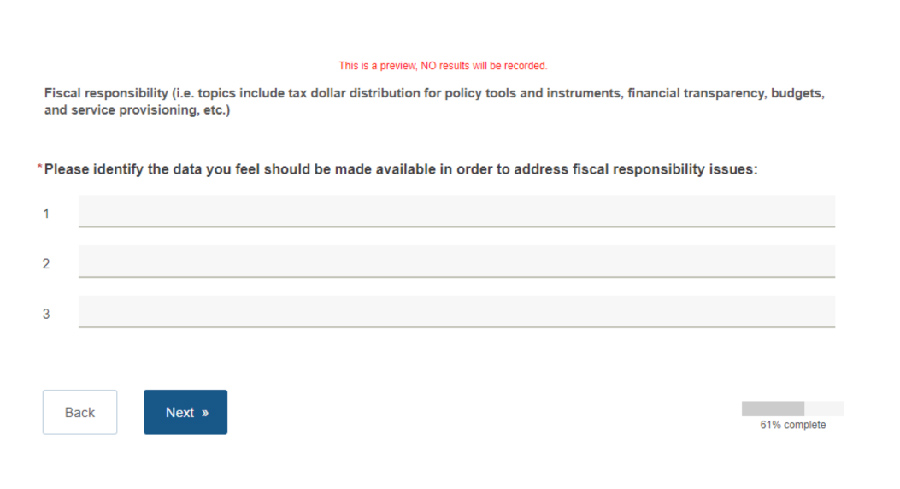
Screenshot of a Checkmarket question asked the user to identify the data they feel should be made available in order to address fiscal responsibility issues.
We shared the questionnaire through our social media channels (Twitter, Linkedin) and newsletters (The Open Data Update, TransformTO) to the public between July 16 and October 2nd 2019.
Each request submitted through the questionnaire will be measured against a recently developed priority framework which uses an algorithm to determine which datasets are most important to release. This allows us to be more strategic when engaging with Divisions/Agencies, allocating time and resources towards the release of datasets that provide the greatest value.
The prioritization framework will eventually allow us to begin assigning a ranking score on all requests we receive. We plan to make these scores publicly available, which will provide greater transparency around the requests we receive and their place in the queue.
The algorithm used to calculate priority is made up of 4 groups, and each element within each group has a unique weighting factor:
Output Source: is the data in a database somewhere or is it in a spreadsheet on someone’s desktop? This impacts the level of effort needed to prepare the dataset for publication, therefore flat files will render a lower score.
Civic Issue: does the dataset align to a civic issue? Since each civic issue renders an equal score of 1, priority in this category is given to datasets that align to the greatest variety of civic issues
Requester: who requested the dataset? Is it requested by council or a member of the public? Different requesters are given different scoring.
Output: what will it be used for? Education? Media? Government city report? Is it for research? Will it be used to create a by-product, like an app?
Priority framework algorithm used to calculate data request scores
Group
Element
Weight
Civic issue
Affordable housing
1
Civic issue
Climate change
1
Civic issue
Fiscal responsibility
1
Civic issue
Mobility
1
Civic issue
Poverty reduction
1
Output
Application development
0.69
Output
City
0.75
Output
Education
0.61
Output
Media
0.59
Output
Personal
0.37
Output
Research
0.59
Requester
Council
1
Requester
Decision support
0.85
Requester
Public
0.75
Requester
Other
0.25
Source
Yes
1
Source
No
0.25
Ultimately, the higher the score, the greater priority the dataset holds. This gives the Open Data team a more strategic approach when identifying datasets for release through the Portal.
Limitations:
There are a few limitations we encountered that required us to modify the application of the priority framework for the purposes of this campaign:
Since the questionnaire was distributed publicly through newsletters and social media, we classified the requestor type as public for each response received.
The questionnaire was designed to collect dataset requests per each civic issue, rather than having the ability to indicate alignment to multiple civic issues for a single request. To keep things simple, each request was given an equal score of 1 under the category of civic issue alignment.
Respondents of the questionnaire were not asked to identify the type of source system a dataset possesses, as this detail would be sourced through engagements with Divisional/Agency data stewards later in the campaign.
For these reasons, we will solely focus on Output when applying the priority framework for all requests received.
Data Preparation: Extracting, Cleansing and Tagging
The first step in preparing the data for analysis started with an extract of the raw data from Checkmarket; the survey tool used to design the questionnaire. To work with the data, I opted for google sheets; a free, accessible and fairly intuitive tool to use that is ideal for basic data preparation and cleansing.
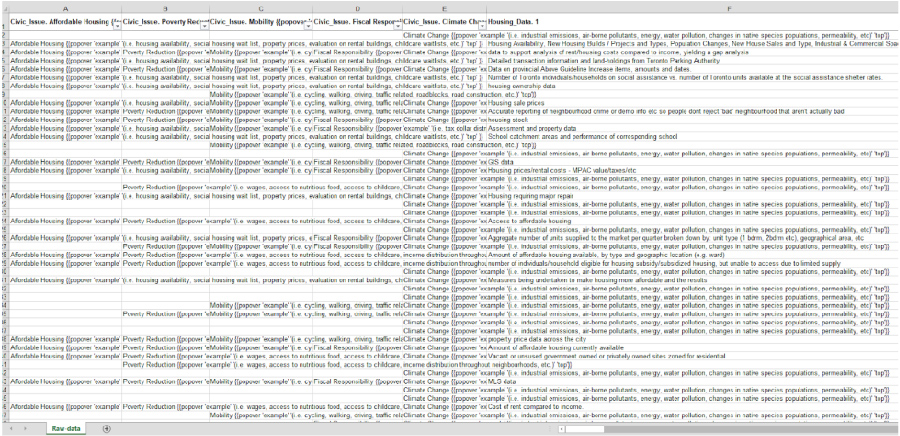
As you can see, the raw data extract from Cherkmarket wasn’t pretty:
Screenshot of raw, complex data extracted from Checkmarket, an online survey toolIn order to clean the data, I separated all requests by civic issue. I then reviewed each response and split requests that referenced multiple datasets in a single request.
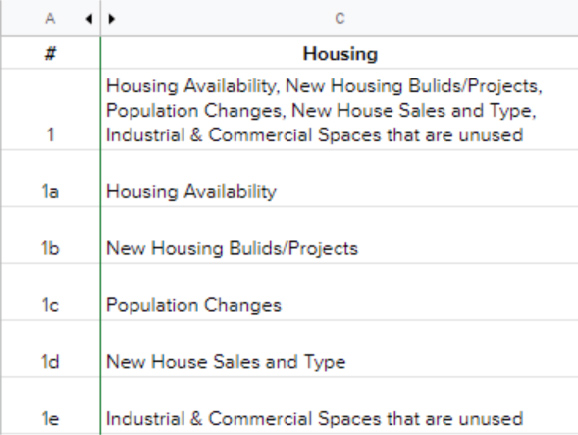
Screenshot of raw survey data requests for Housing
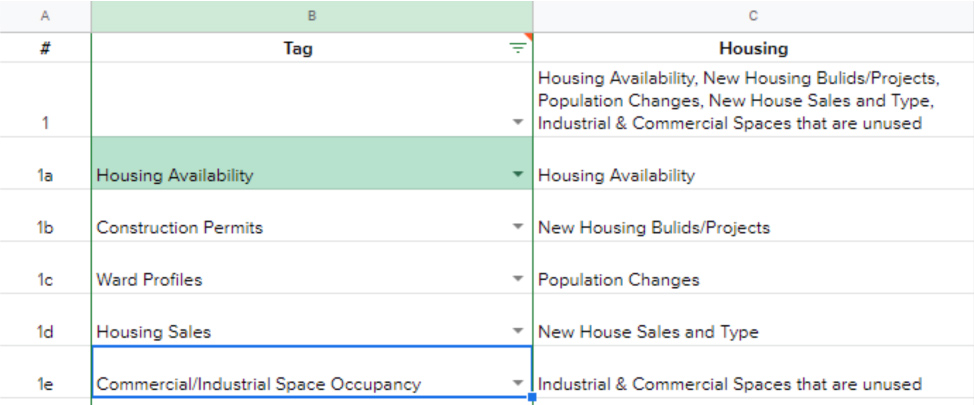
Once I extracted individual requests from all the responses received through the questionnaire, I began ascribing each request a thematic ‘tag’, for instance; spending, taxes, construction, water, pollution.
Screenshot of raw survey data with tags applied
This exercise allowed me to begin clustering similar requests under a shared theme. The challenge for me was avoiding the use of similar tags (e.g. Energy use, Energy Spending, Energy Consumption) as well as clustering requests objectively with limited context readily available.
Analysing the data for key insights
Before diving into the analysis, I identified a number of research questions I was interested in answering:
Which civic issue received the most requests?
What are the top data requests that were identified for each civic issue?
What else does the data reveal?
When reviewing the total number of requests received per civic issue, the breakdown was the following:
256 – Climate Change,
225 – Affordable Housing,
154 – Poverty Reduction,
146 – Mobility,
94 – Fiscal Responsibility
I then looked at the top tags collected per civic issue. Again, each tag represents the thematic grouping of similar dataset requests. The tables below display what were the most popular tags associated with each civic issue, as well as how many individual requests the tag represents.
Individual tags by count
Affordable Housing
Tags
Count
N/A
25
Housing availability
24
Rent cost
18
Housing sales
12
Neighbourhood profile
9
Short-term rentals
8
Affordable housing waitlist
8
Official plan
6
Vacancy tax
6
Ward profiles
5
Home ownership
5
Rent registry
5
Poverty reduction
Tags
Count
Neighbourhood profiles
30
N/A
16
Food by ward
10
Childcare availability
8
Ward profiles
8
Pedestrian network
6
Childcare costs
4
Employment
4
Housing costs
3
Poverty reduction strategy
3
Transit
3
Mobility
Tags
Count
N/A
28
Accessibility
10
Bike network
10
Traffic
8
Collision/fatalities
6
Road restrictions
5
Construction projects
4
Presto
4
TTC routes and schedules
4
Fiscal Responsibility
Tags
Count
N/A
25
Budget
13
Taxes
9
Spending
8
Revenue
4
Section 37
2
City debt
2
Voting record
1
Transit project budget
1
Transform TO
1
Climate change
Tags
Count
Pollution
64
N/A
37
Flooding
13
Energy use
13
Weather
11
Tree
9
Waste
8
Green
8
Natural heritage system
8
Utility spending
5
Land use
4
Water quality
4
Energy
4
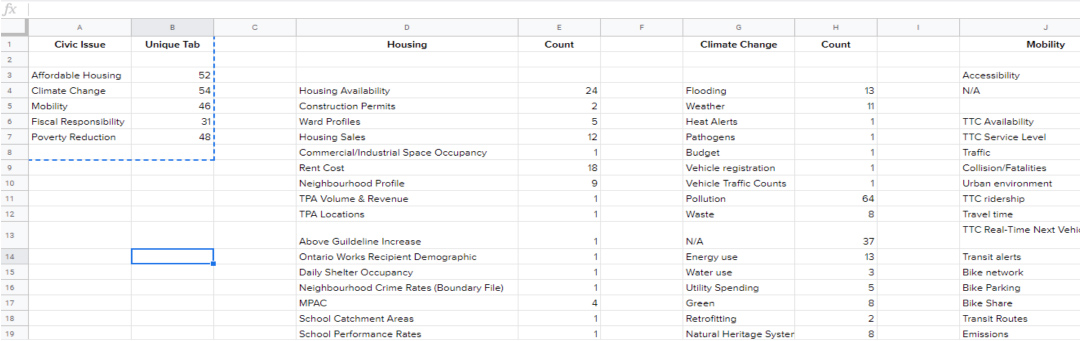
In total, there were: 54 unique tags for climate change, 52 for affordable housing, 48 for poverty reduction, 46 for mobility, and 31 for fiscal responsibility.
Screenshot of count of all tags per civic issue request
What was surprising was the number of N/A tags applied to the requests received for each civic issue. Requests with an N/A tag were in fact requests for information, policies, procedures; too general or broadly phrased (e.g. ‘water data,’ ‘budget data’); or not a dataset request at all (e.g. a rant or complaint). This leads me to conclude that open information is highly desirable and needs to be made more accessible to the general public.
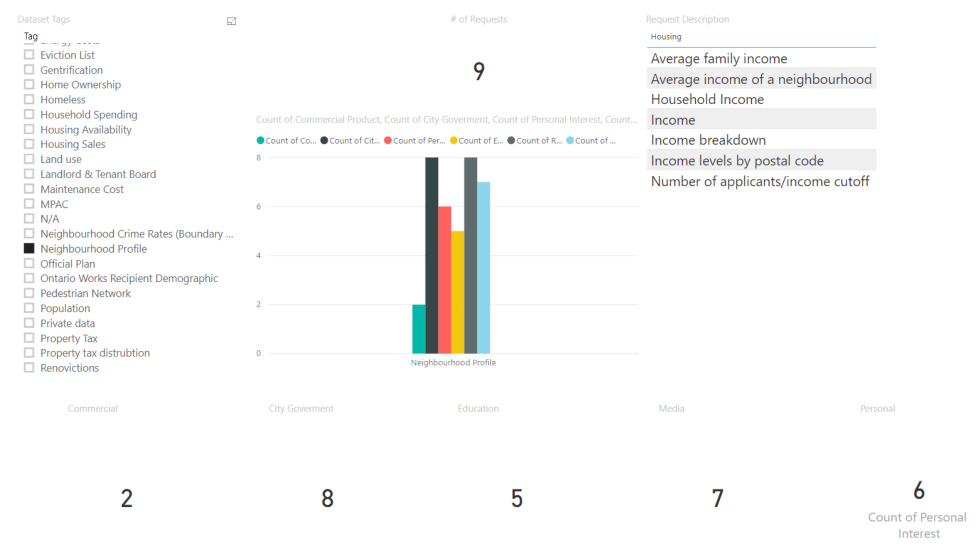
What is also interesting is that many of the requests received were related to datasets already made openly available through the Portal. An example of this when reviewing the numerous requests for demographic and income data, such as income by neighbourhood, which exists in our Neighbourhood Profile dataset. These findings indicate a need for improved search and discoverability of datasets on the portal, particularly those that align to civic issues.
Screenshot of neighbourhood profile tags visualized using a bar chart.
Conclusions & Next Steps:
This is a simple, preliminary analysis of the requests received through the civic issue campaign, which has resulted in some interesting, unexpected findings, such as requests for data already available through our Open Data portal.
In terms of next steps, we will analyze all requests received in order to determine their level of priority, particularly in relation to the recent recent motion passed by the General Government and Licensing Committee.
How you can help:
Want to take a stab at analyzing which requests received through the campaign will have the greatest priority score using our prioritization framework? Check out the dataset on our portal, and be sure to share your findings with us by emailing opendata@toronto.ca.