Blog article: When Pandemic Met Data – A Journalist’s Journey into the Open Data Portal

Article text
In this blog post: Matt Elliott, Publisher of City Hall Watcher newsletter and Toronto Star contributor, shares his experience of how the city’s Open Data Portal transformed his reporting during the COVID-19 pandemic. Stranded without traditional municipal news to cover, Elliott dove into a wealth of available datasets, discovering a myriad of untold stories about Toronto. Grab a cup of coffee, sit back, and join Matt as he takes you on an intriguing journey of discovery, right here in Toronto.
The stories are in the data: opportunities for journalists on Toronto’s Open Data portal – written by Matt Elliott (Publisher, City Hall Watcher newsletter and Toronto Star contributor)
At the beginning of March 2020, I was feeling like I was in a pretty good groove. I was about a year into the launch of City Hall Watcher, my weekly newsletter covering local politics in Toronto. I was gearing up to cover the busy spring schedule of council and committee meetings. But then, well, there was a pandemic — maybe you heard about it? — and all my editorial plans ended up in the scrap heap.
And so began my long and enduring love affair with Toronto’s Open Data Portal.
Stuck at home with little municipal news to cover — it took several weeks before the City Clerk started virtual meetings — I was desperate for newsletter content. As a journalist, the Open Data portal offered immediate opportunities for valuable analysis on a range of local issues.
I started by using the Mobile Watch Your Speed Program – Detailed Speed Counts dataset to generate a list of the places where drivers were clocked going way above the speed limit. I then looked at the Members of Toronto City Council – Voting Record dataset to generate attendance records for the mayor and councillors based on how many votes they missed.
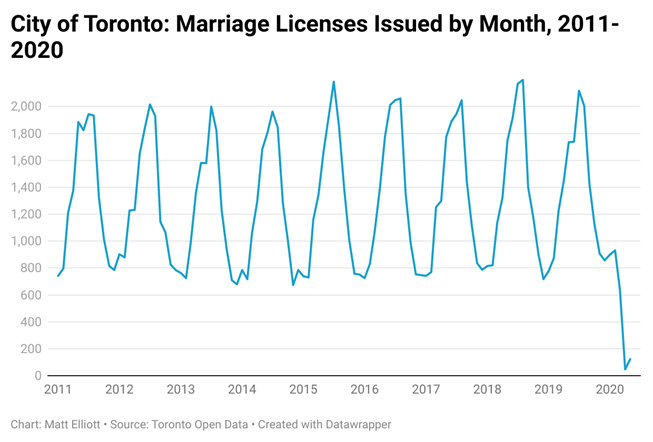
Some of my data reporting was related to the pandemic. Analysis of the Marriage Licence Statistics dataset, for example, provided an interesting glimpse at the effect of COVID-19 shutdowns, as the number of licenses reported in the data suddenly plummeted.
But I also found a lot of value in going back further. With the Traffic Volumes at Intersections for All ModesI started publishing “Intersection Inspection” analyses of traffic counts at selected intersections, using data that dates all the way back to the go-go 1980s. Some of it is older than I am.

Things at city hall eventually started to go back to something approximating pre-pandemic normal, but my Open Data analyses continues to this day. I do monthly reports on lobbyist activity based on the Lobbyist Registry dataset, regular “Intersection Inspection” features, and other stories where I challenge myself to dig into new datasets. The Elections – Campaign Contributions dataset of municipal campaign contributions dating back to 2006 provided a great basis for analysis before and after last fall’s municipal election.
Still, I feel like I’ve barely scratched the surface. There are a ton of untapped opportunities here for journalists.
For me, it starts with a dogged belief that every dataset has an interesting story to tell. It often isn’t clear from the title of the dataset. They’re not usually given very exciting names.
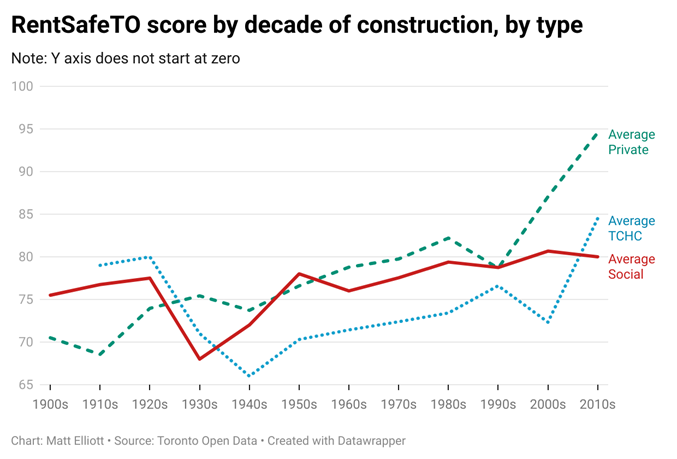
And sometimes it just takes a bit of rearranging — or a few Excel formulas doing things like summing up some monthly or annual numbers — to find it. Sometimes it can take longer. I spent a long time trying to figure out a way to present the data in the Apartment Building Evaluation dataset, for example, before I published my analysis of the RentSafeTO program.
And sometimes, unfortunately, the data is not complete or current enough to deliver on the promise of a dataset, though I know there are ongoing efforts to fix that. It can be incredibly frustrating when a dataset hasn’t been updated in years, or formats change so that direct comparisons can’t be made for a program or service over time.
Still, I’d encourage all journalists interested in covering the city to carve out some time with the Open Data portal. There are stories in this data, lurking in XLS and CSV files, that tell the tale of an evolving city. It’s been fun and rewarding to find some of them.