Blog article: Measuring Sound from the Bedroom Window
Article text
In this captivating blog post, Ingrid, a local resident, shares her personal journey of uncovering the impact of noise pollution on her life and her quest to better understand and quantify its effects. Amid the COVID-19 pandemic, Ingrid noticed changes in her soundscape that negatively affected her quality of life, leading her to take action. Ingrid’s story aligns with the goals of the Open Data Master Plan, advocating for data-driven solutions and emphasizing the importance of including community-sourced and third-party datasets. This approach not only encourages innovation but also bolsters civic engagement, empowering citizens to actively contribute to improving their urban environment. Ingrid’s efforts to collect citizen-submitted data showcase the power of grassroots initiatives and the significance of community involvement in creating better urban spaces.
So, if you too have embarked on your own journey of data collection and would like to share your story, please reach out to us at opendata@toronto.ca. We’d love to hear from you! Now, dive into her story.
My story (Ingrid’s story)
Before COVID I started to notice changes in my soundscape. When I was in my bathroom I could hear a car’s muffler on the highway, bikes and cars started to be so loud that the noise interrupted my conversation with my partner on the 25th floor of my condo. I couldn’t enjoy my balcony anymore. Then they started to wake me up at night, more frequently. My residence hadn’t changed, so something in my environment had.
One morning around 3am, during the lockdown when our streets and highways were mostly empty, I was woken up by one single motorbike on the highway. I heard it for 10 minutes (for about 7 km) and knew where it was by the sound. For example, it got softer when it was in a depression and louder when it used an elevated ramp to connect to another highway.
This one driver, this one engine, this single source of sound, disturbed my sleep and surely the sleep of many others. I wondered how many people’s sleep had been disturbed? How loud was it? This was one driver passing by my place, one time. What about when there are more? How many people does one motorbike, or one modified vehicle affect in its daily use? What are the health effects of this noise, other than feeling terrible the next day? I decided to learn about sound – and unwanted sound – called noise.
Health Effects of Noise
Toronto Public Health commissioned a Noise Study in 2016, the results are in How Loud is Too Loud. I learned noise pollution is the #2 Urban Environmental Health Hazard, right after air pollution. Negative health effects start at 55 decibels (db) and the World Health Organization (WHO) recommends 45 db for a restorative sleep. Not only does noise impact our quality of life, but also has other health impacts, such as cardiovascular effects, cognitive impacts, sleep disturbance and mental health effects. The Ontario Ministry of Environment and Climate Change has recommendations for road-related noise thresholds: for sensitive land uses, such as residential uses, mitigation measures are required if outdoor levels at the centre of a window or door opening exceed 55 dBA daytime or 50 dBA nighttime. The study found that 88.7% of the population is estimated to be exposed to levels above 55 dBA during the day, and 43.4% is estimated to be exposed to above this level at night.
In the report, heat maps showed that our highways and arterial roads produce between 70 to 90 db and were loud, yet they didn’t reflect what I was living with. I wondered if I was alone and started tweeting about excessive vehicle noise. I learned that I was not the only one annoyed at this small percentage of people who created this unnecessary noise that was impacting our health and quality of life. My anxiety climbed along with my level of annoyance at the increasing frequency of the noise events most days and nights.
Data Collection
My background in HR and IT taught me that data tells a story, so I knew that I needed to start collecting data about what I was experiencing. I bought an environmental sound meter in July 2021 and immediately felt vindicated when it logged multiple noise spikes through the night, going from 60 or 70 db to 80 and even over 90db.
Then a friend forwarded a link to Toronto Metropolitan University’s YouTube on the Health Effects of Urban Traffic Noise featuring Tor Oiamo. Not only was it informative, when he said that “we don’t know enough about noise at the bedroom window” I shouted, “Yes!” The models use averages, because without access to a “bedroom window” this was the best data they had. Here was my niche. First, I needed to measure my soundscape and eventually also from other people’s bedroom windows to understand what we live with. Modelling can only go so far, it was time to collect citizen data.
I learned that when taking measurements, the average sound level (LEQ) is like a high water mark on a lake, obscuring what lies below. And it was those events that maybe didn’t break the surface, but were audibly different frequencies and events that annoy us and impact our health.
I was lucky enough to have my meter on a balcony when the Gardiner was closed for the Ride for Brain Health. In the graph below, you can see the drop of the average when the Gardiner was closed at 2:30am, which exposed the resulting noise events that a model will not show. The orange line is the World Health Organization’s recommended level for a restorative sleep – 45 db. The measurement below was taken with an Environmental Sound Meter from Cirrus Research.
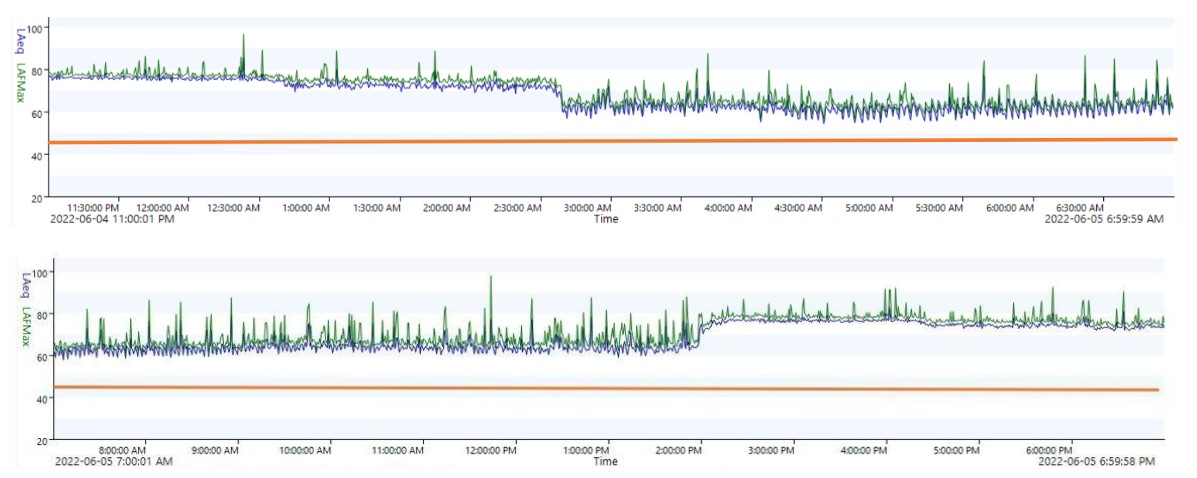
In the graphs above, these spikes are caused by vehicles and motorbikes. Combined there were over 70 spikes between when the highway was closed at 2:30am and reopened at 2pm. Looking at the spike at 12:30 am from 78 to 98 db, our perception of that loudness is not an increase of 20 db. We perceive that to be an increase 12x louder than it was at 78 due to sound being logarithmic, for example to go from from normal conversation to someone pointing a hairdryer directly at your ear. Now it was easier to “see” what we feel and live with.
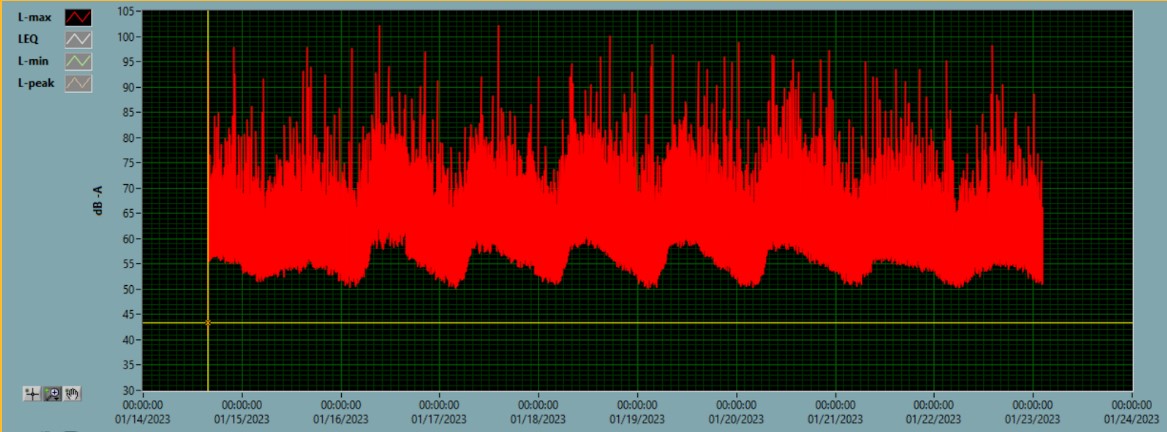
The graph below is from the location with the loudest spikes, which was the 15th floor at Sherbourne and Adelaide. Over the course of 7 days there were at least 44 spikes over 90 db (double the WHO recommendation) both day and night, due to sound bouncing off of the buildings. This measurement was taken with a noise sentry meter built by Convergence Instruments.
I have only one location that met the WHO guideline of 45 db, a leafy residential neighbourhood, The Kingsway.
I have now collected 1,000s of hours of recordings from my balcony and other locations, that produce csv’s of sound levels by the second. I am working with people from Civic Tech Toronto to build a database to query this data and to possibly make it available to the public.
City of Toronto Noise Bylaws
The city’s noise bylaws were being discussed at City Hall in Spring of 2022, specifically vehicle noise. The city received over 900 emails regarding noise from combustion engines. I heard from both the city and people that catching moving violations is difficult for everyone and that residents had lost hope in reporting noise complaints.
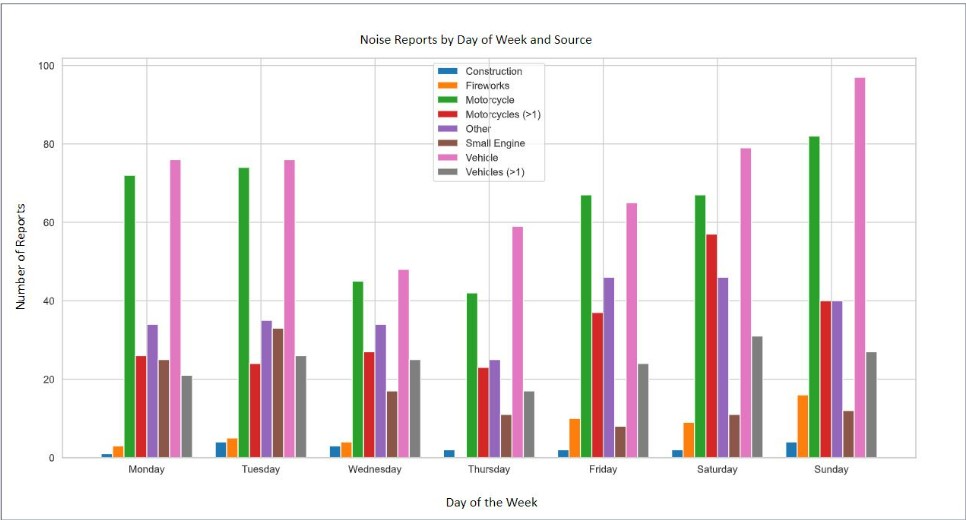
To help people know that they were not alone, and maybe to help TPS target problem areas, I created the Not 311 Noise Report. Through this web app, people can identify the location of the noise source, what produced it and when. Different from 311, people can see the location of all noise reports in the Noise Report Dashboard. In two months, we had almost 1,800 reports. In the graph below you can see a chart of the different noise sources and day of the week; cars, pickup trucks and motorcycles being the most common complaints.

I am pleased to announce that I have just released a more comprehensive “Not 311” Noise Report in advance of the full launch on May 4th, in conjunction with Hot Docs Citizen Minutes Program.
You can view the Not 311 Noise Report Dashboard and learn more here: No More Noise Toronto.
Conclusion
We learned during COVID that cities aren’t loud, vehicles are loud. And I also learned that what changed in my environment was the removal of the Drive Clean program by the Provincial Government, eliminating vehicle inspections.
With the transition to EVs there is an opportunity to advocate for stronger noise regulations on all levels of government to ensure that those who need to hear vehicles do, and those of us that don’t need to hear them for our safety – don’t. Dodge should not be able to produce a vehicle that emits 126db of unnecessary vanity noise.
We also know that Toronto is building more condos than any other city in North America and these people will be living above any type of noise mitigation (trees, green spaces & noise barriers). While noise dissipates over distances, clearly one engine can be heard from 7 km away and be heard over 50 stories high. This will place a greater burden on our healthcare system and reduce the quality of life and negatively impact the health of those living within earshot.
We can make a healthier, calmer city and citizen submitted data is the story that will help us do that.
This supports the city’s vision of an inclusive and collaborative open data ecosystem, where diverse contributors can actively participate and add value to the wealth of information available to the public.