Blog article: Exploring Equity in Child Care: A Data-Driven Analysis of Access and Demand

Article text
Thomas Fox is a 4th year undergraduate student at the University of Toronto’s Faculty of Information. His research focuses on information policy and the human impact of socio-technical systems. This paper was written for Professor Rohan Alexander’s course Worlds Become Data (INF312) at the University of Toronto.
This post explores issues of equity, access, and demand surrounding licensed child care spaces throughout Toronto’s 25 wards. By examining information made available through Open Data Toronto related to licensed child care centres as well as the demographic information related to each ward from the 2021 Canada census, a detailed analysis is made possible. This data is easily accessible on Open Data Toronto’s website and is a useful resource for researchers and community members to explore and locate child care information. An interactive map can be found in the “Data Preview” tab at this link: https://open.toronto.ca/dataset/licensed-childcare-centres/.
Child care is essential to the social and economic health of a community such as the City of Toronto. Access to child care has been shown to have a positive impact on occupational and educational opportunities for parents, especially those in lower income brackets (Gunaseelan 2021). These economic advantages for parents and families bring benefits to their physical and social well-being. Child care access also has a positive impact on the health and development of children attending these facilities, especially those who are most vulnerable (Rhijn et al. 2021; Underwood and Frankel 2012). Equitable access to child care is therefore a vital facet of community health and development.
The findings of this analysis demonstrate inequitable access to child care across the city of Toronto based on each ward’s average household income, English language prevalence, and proportion of the population identifying as racialized. As child care plays a central role in the social and economic well-being of communities and has an especially positive impact on vulnerable populations, these findings support measures and initiatives aimed at ensuring more equitable access to child care in the city of Toronto.
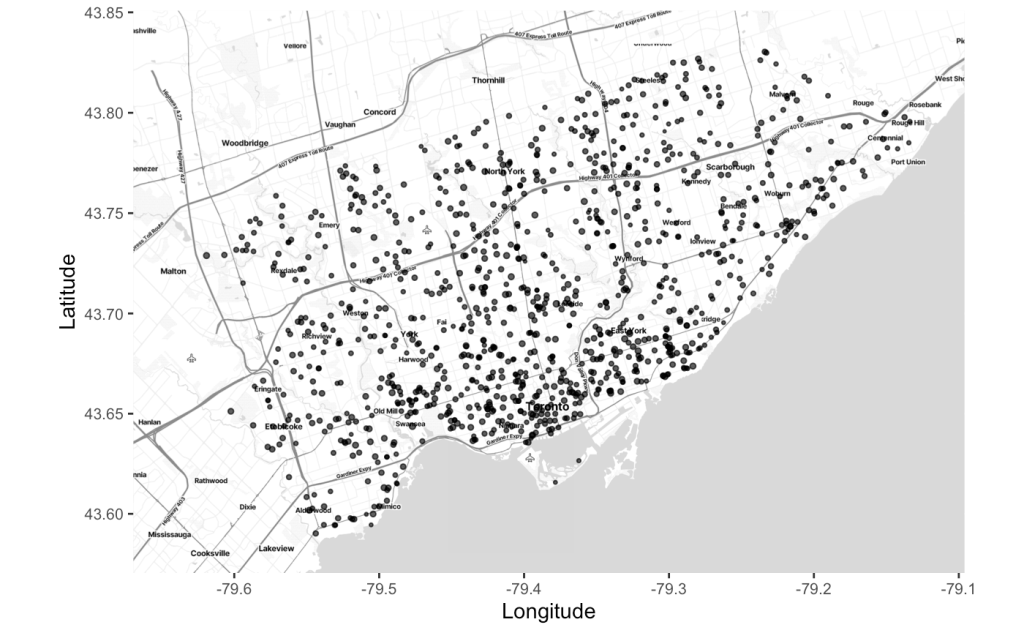
The “Licensed Child Care Centres” data set is provided to Open Data Toronto by the City of Toronto’s Children’s Services division. The data is updated on an ongoing basis with the data used in this post being current as of April 19, 2024. The data set contains one entry for each licensed child care facility in Toronto. Variables in the data set include facility names and addresses, the ward number in which each facility is located, and the total number of individual child care spaces at the facility, amongst others. The data set also contains each facility’s operation type, whether it be non-profit, commercial, or public (City operated). Information about whether each facility has a fee subsidy contract or participates in the Canada-Wide Early Learning & Child Care (CWELCC) system is also included. Figure 1 utilizes the data set’s location information to map each of Toronto’s licensed child care facilities.
The “Ward Profiles (25-Ward Model)” data set is provided to Open Data Toronto by Toronto City Planning. The data set of interest found through this resource is the “2023-WardProfiles-2011-2021-CensusData” set which is used to determine demographic information of interest for each ward. Variables of interest for this analysis include ward numbers and names, total population, population under 15, average yearly household income, number of households where English is spoken most often, and population identifying as racialized. This data set is useful when exploring relationships between social or demographic factors and the various data sets made available through Open Data Toronto.
To explore the effect that household income, language, and racialized population may have on child care access, both data sets are used to determine the number of children under the age of 15 for every existing child care space in each ward, as shown in Figure 2. These values help indicate the demand for child care spaces across Toronto’s 25 wards.
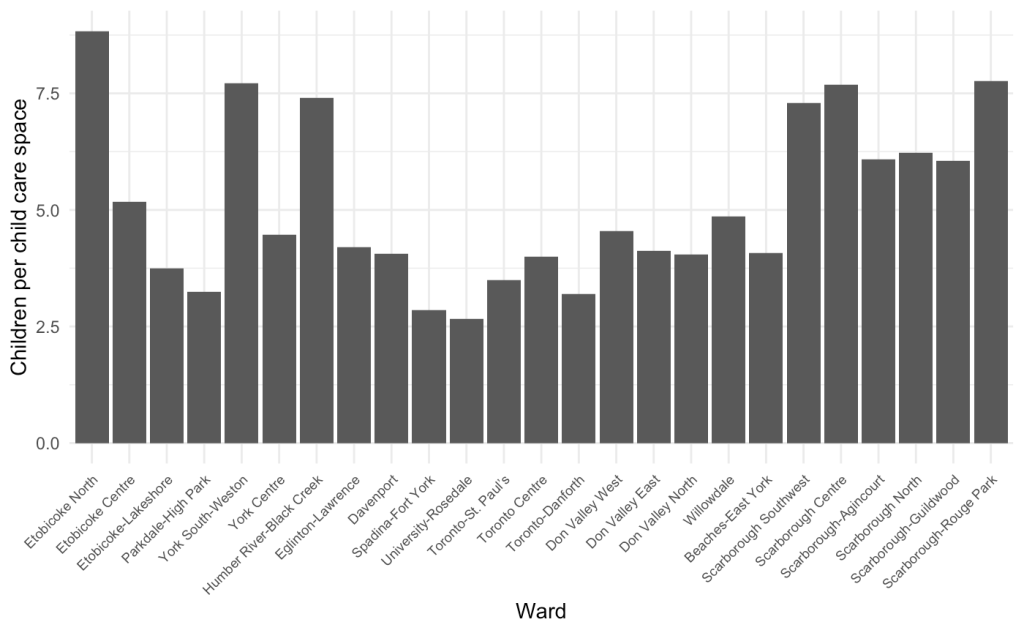
Figure 3 aims to assess the relationship between average household income and children per child care space in Toronto’s 25 wards. The plot shows a negative correlation between average household income and children per child care space. The seven wards with the lowest average household income have an average of 6.8 children per child care space, while the seven wards with the highest average household income have an average of 3.9. These findings suggest that there is increased competition for child care spaces in wards with lower incomes and decreased competition for spaces in wards with higher incomes.
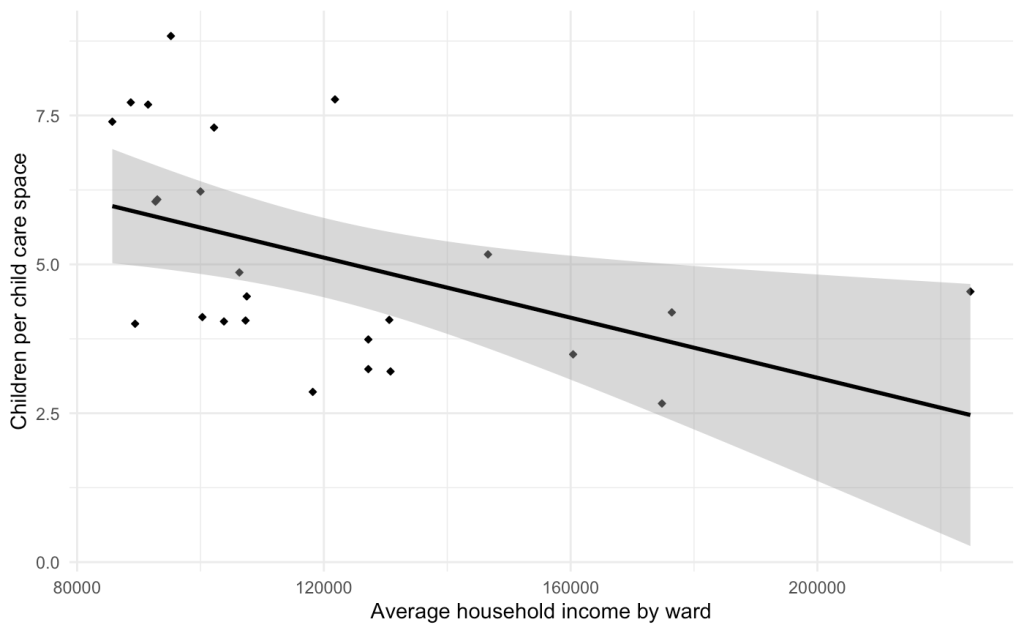
Figure 4 explores the relationship between English-speaking household populations and children per child care space in Toronto’s 25 wards. The plot shows a negative correlation between the proportion of English-speaking populations and children per child care space. The seven wards with the lowest proportion of English-speaking households have an average of 6.42 children per child care space, while the seven wards with the highest proportion of English-speaking households have an average of 3.9. These findings suggest that wards with large proportions English-speaking population proportions have decreased competition for child care spaces.
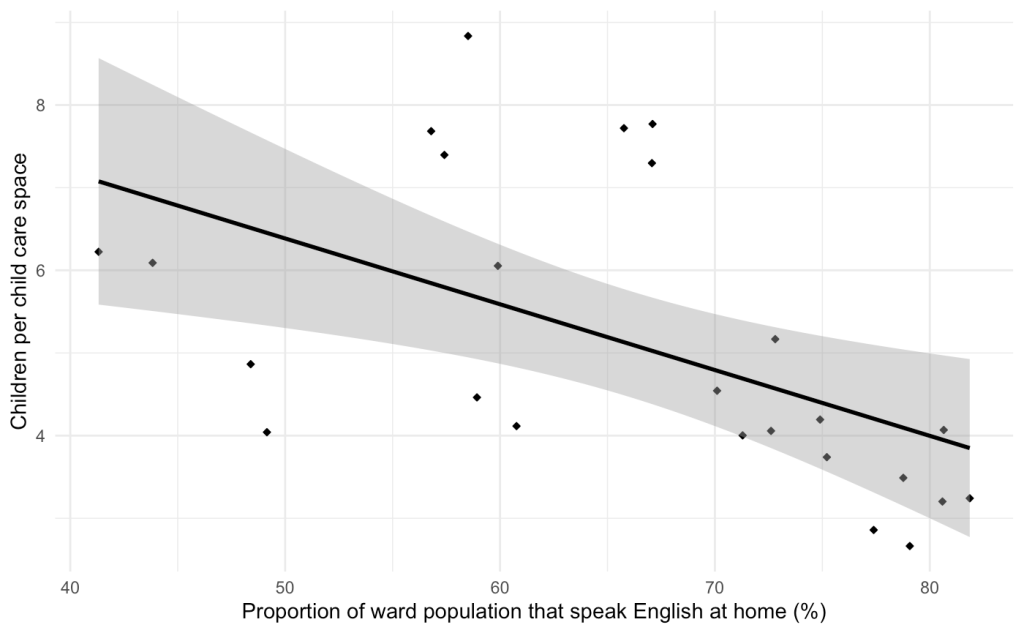
Figure 5 examines the relationship between racialized populations and children per child care space in Toronto’s 25 wards. The plot shows a negative correlation between the proportion of populations identifying as non-racialized and children per child care space. The seven wards with the lowest proportion of non-racialized residents have an average of 6.62 children per child care space, while the seven wards with the highest proportion of non-racialized residents have an average of 3.8. These findings suggest that wards with large proportions of their populations identifying as non-racialized have decreased competition for, and increased supply of child care spaces.

As outlined in Figure 3, a negative correlation exists between average household income and children per child care space across Toronto. In Figure 4, a similar trend is displayed with fewer children per existing child care space in wards with higher proportions of English-speaking households. Figure 5 shows a negative relationship between the proportion of residents identifying as non-racialized and the number of children per space. These findings suggest wards with higher incomes, higher proportions of English-speaking households, and lower proportions of racialized residents contain fewer children per existing child care space, and therefore, increased accessibility to licensed child care.
These findings are troubling for a variety of reasons. Children with at least one parent who speaks a language other than English in the home benefit disproportionately from child care access when compared to children from English-speaking households (Maki Park and Giang 2022). Income disparity related to child care access is especially concerning as both dual language and racialized children are more likely to experience poverty (Tome 2021). With Toronto having the highest rate of income inequality between racialized and non-racialized individuals in Canada, these findings are particularly relevant (Tome 2021). As quality child care is an instrumental facet of community, family, and individual health, these findings support any steps taken to ensure equitable access to quality child care across the city of Toronto.
This post was derived from the paper: “Inequitable Access: An Analysis of Licensed Child Care in Toronto’s 25 Wards in 2024”, where these topics are explored in more detail. The paper can be found here: https://github.com/ThomasWilliamFox/child_care_access.git.
Gunaseelan, Vinusha. 2021. “A New Normal for Child Care in Canada: Accessible, Affordable, Universal. Wellesley Institute.”https://www.wellesleyinstitute.com/children-youth/a-newnormal-for-child-care-in canada-affordable-accessible-universal/; broken link.
Maki Park, Jacob Hofstetter, and Ivana Tú Nhi Giang. 2022. “Overlooked but Essential: Language Access in Early Childhood Programs.” https://www.migrationpolicy.org/sites/default/files/publications/mpi_ecec-language-access-2022_final.pdf.
Rhijn, Tricia van, Kathryn Underwood, Elaine Frankel, Donna S. Lero, Karen Spalding, Magdalena Janus, Martha Friendly, and Arlene Haché. 2021. “Role of Child Care in Creating Inclusive Communities and Access for All.” Canadian Public Policy 47 (3): 399–409. https://doi.org/10.3138/cpp.2021-010.
Tome, Samantha. 2021. “Racialization of Poverty.” https://horizonsforyouth.org/blog/racializationofpoverty#:~:text=Racial%20disparities%20therefore%20ccur%20in,the%20%27racialization%20of%20poverty%27.
Underwood, Kathryn, and Elaine B Frankel. 2012. “The Developmental Systems Approach to Early Intervention in Canada.” Infants & Young Children 25 (4): 286–96. https://doi.org/10.1097/IYC.0b013e3182673dfc.