Blog article: Top Open Data Moments in 2019
Article text
1. The Open Data Update
Toronto Open Data started releasing a monthly email update in early 2019. We wanted a way to mark the end of each month with an overview of what the team has been working on, and to share our work with the wider community outside the curved walls of City Hall. The newsletter also gives us valuable insight into the types of users interested in our work. Subscribe to the monthly open data update (no longer available) to learn about upcoming events, publications, and opportunities to get involved!2. A new home for open data
We spent 2018-2019 working extensively on our new portal. We evaluated the portal’s user experience as we went along, tailoring it to our users’ unique needs. Once we had enough evidence supporting the value of our new portal, we were able to migrate from the sandbox to our new home: open.toronto.ca. While a domain change may not seem like a big deal, it’s pretty meaningful. As a result of this migration, we’re seeing significant growth in visits to the portal, total downloads as well as user engagement. Our users tell us that the new domain makes it easier for them to find what they’re looking for, which increases their uptake of open data.3. Committee motion
Thanks to the efforts of key open data advocates like Mark Richardson, CTO Lawrence Eta, and Councillor Paul Ainslie, a committee motion was passed in May 2019 “[to] publish all historical and current data embedded in documents, reports, or any digital artifacts that are available publicly on the City of Toronto’s digital infrastructure to be made available on the City’s Open Data portal”. This is an exciting time for open data! We have to add the bulk increase in dataset submissions in 2020 as a result of this motion may create a slightly longer waiting time for new releases.4. Dataset Quality Score
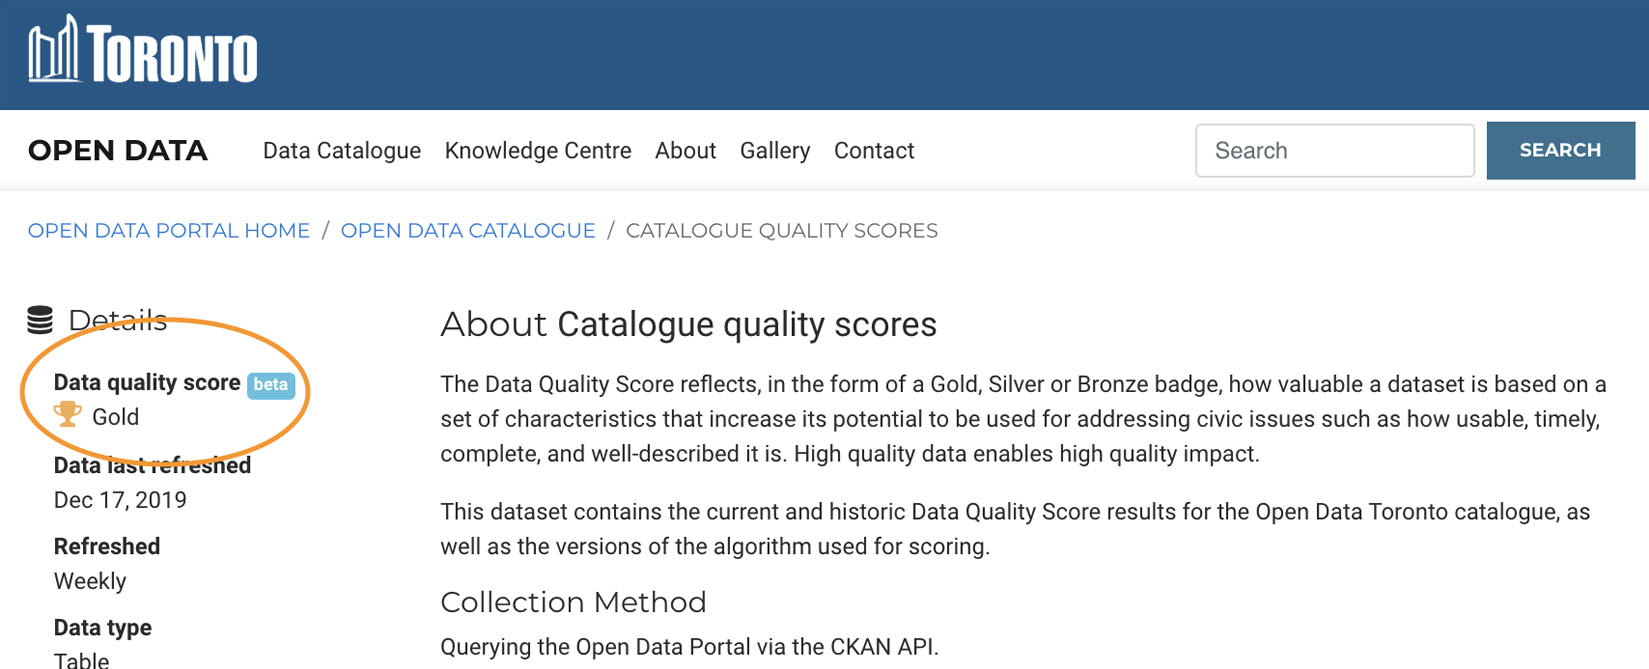 One of our 2019 priorities was establishing the new Dataset Quality framework. We parsed all of the datasets presently listed on the open data portal and assigned each one a quality score. If you’re interested in how we analyzed and scored the datasets, you can read all about it here: Towards a Data Quality Score.
We evaluated quality score based on a number of important criteria, including completeness of the data, machine readability, usability, completeness, etc. This allows us to not only encourages improved data quality and consistency with our partners, but also ensures that our upcoming dataset releases align with what we’ve heard from the public. The open data portal is, ultimately, a public service tool, so it’s essential that we ensure we deliver a high level of standardization and data quality to best enable users to work with it.
One of our 2019 priorities was establishing the new Dataset Quality framework. We parsed all of the datasets presently listed on the open data portal and assigned each one a quality score. If you’re interested in how we analyzed and scored the datasets, you can read all about it here: Towards a Data Quality Score.
We evaluated quality score based on a number of important criteria, including completeness of the data, machine readability, usability, completeness, etc. This allows us to not only encourages improved data quality and consistency with our partners, but also ensures that our upcoming dataset releases align with what we’ve heard from the public. The open data portal is, ultimately, a public service tool, so it’s essential that we ensure we deliver a high level of standardization and data quality to best enable users to work with it.
5. Getting meta with Dataset Quality
As a partner piece to the data set quality score, we also decided to create a publicly available dataset that can be used for further analysis as well as for visualization purposes to better understand the ‘health’ of our project and program. You can access this data here: Dataset Catalogue Quality Scores. Let us know if you do something interesting with it, and your work just might be featured on the open data portal!6. Dataset Priority Framework
To help us be more strategic in the way that we identify and release open datasets, we created our very first data prioritization framework. This is an algorithm that helps us assess and ascribe a prioritization score for a dataset based on multiple factors. Together, these considerations will enable us to better prioritize the release of high-quality, in-demand open data. More details on the framework can be viewed here: Open Data Priority Framework.7. Civic Issues Campaign
We launched a Civic Issues campaign to align dataset requests with key City priorities. We asked the public what data they need in order to tackle these key civic issues, including how it will be used and how it aligns to key civic issues/priorities. Each request submitted through the survey was measured against a recently developed priority framework, which uses an algorithm to determine which datasets are the most important to release. The raw data from the survey will be shared publicly, along with a list of which dataset requests we will start releasing, as a result of this survey in 2020.8. LVQ: QGIS, R, Google Sheets & Visualizations
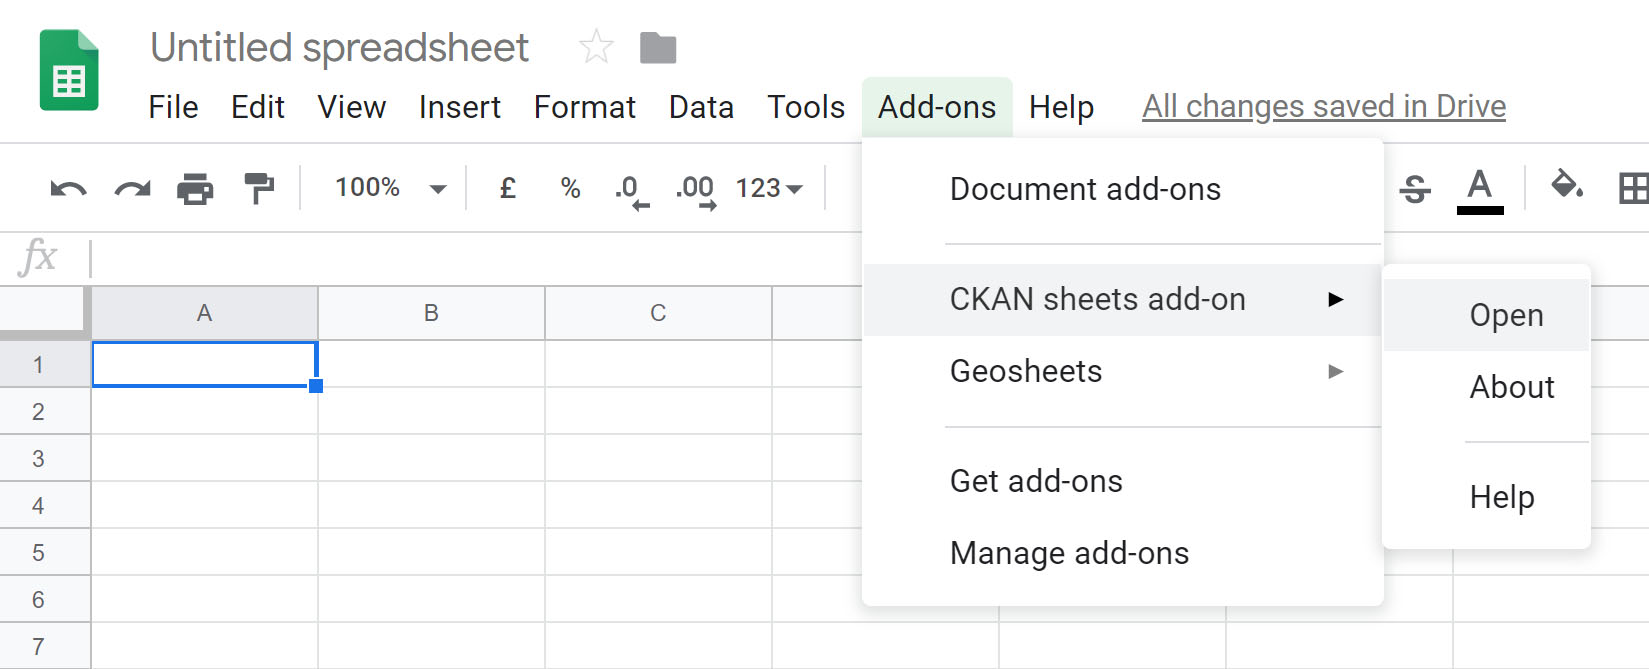 One of our favourite initiatives in 2019 was the release of four LVQs. An LVQ, or ‘lower-value quote’ is a request for proposals for smaller-sized projects that don’t need significant funding or resources, so we can pitch for solutions within our open data developer community and funnel some funding into smaller scale open data projects. Our mandate of making our products publicly available stands, which means that the global community benefits from our open source releases. We’re thrilled with the deliverables, which include Evert Pot’s Google Sheets Add-on, Sharla Gelfand’s R package for open data, QGIS location mapping by BergWerkGIS, and a soon-to-be released CKAN visualizer by open source consultancy Keitaro.
9. Sharing with our friends down under.
Speaking of sharing, we were excited to have the first jurisdiction use our open source docker container to build their own CKAN-powered open data portal. This is pretty exciting, as it means other municipalities can harvest our work to build better open data communities across the world.10. Reddit AMA
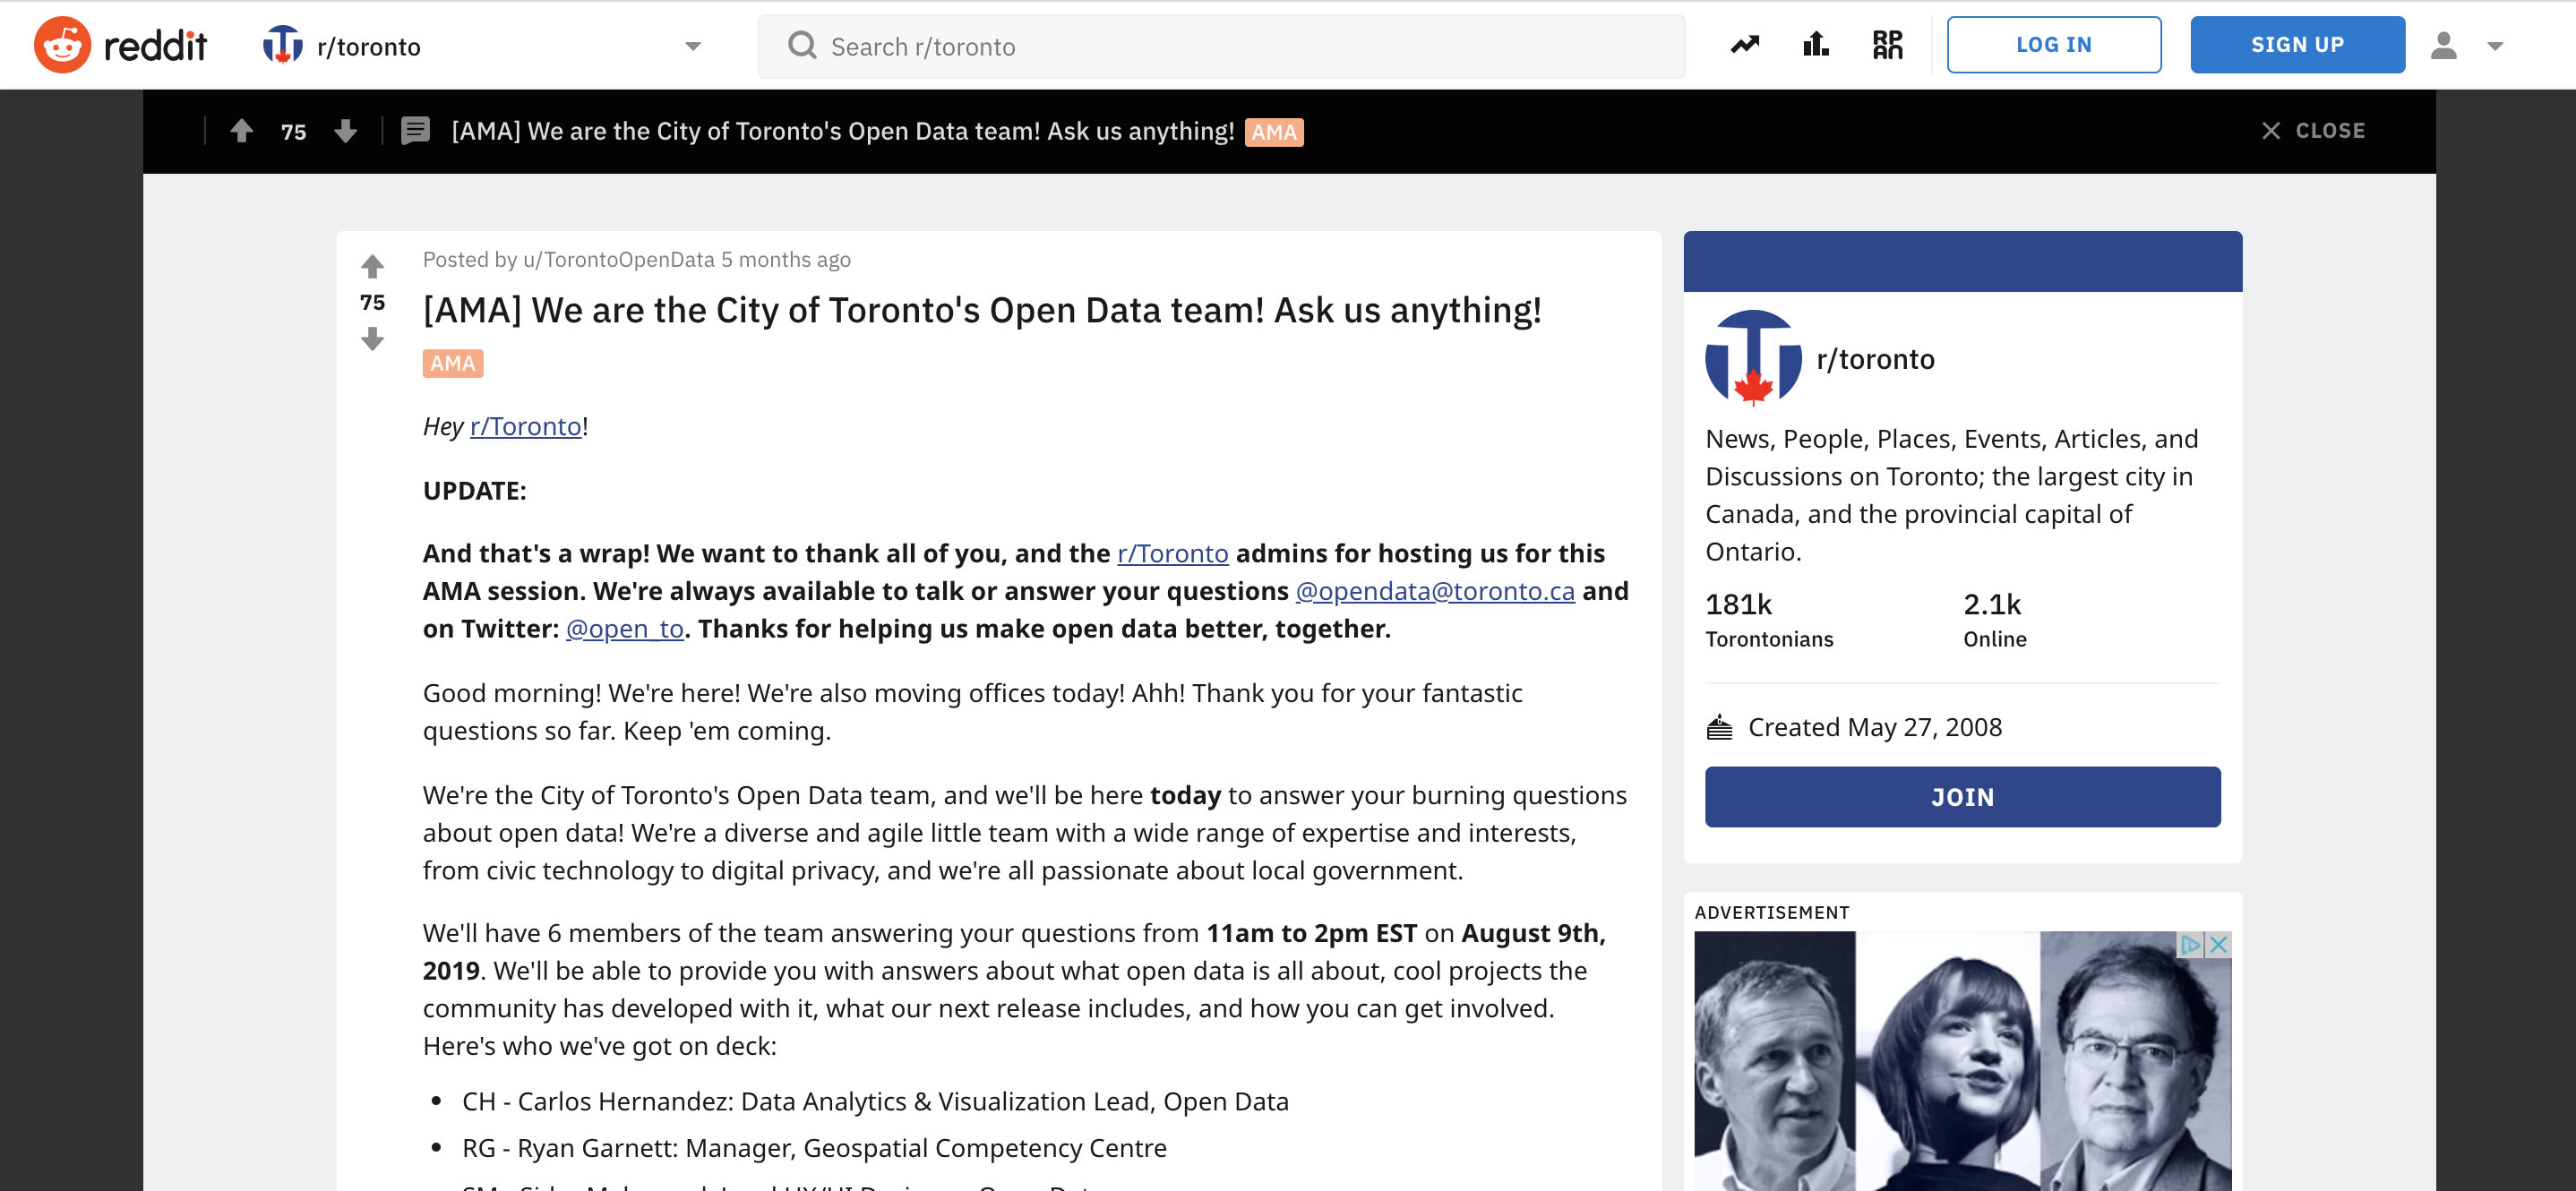 In August, we were hosted by the very active online community /r/Toronto (181,000 individual members!). We spent the day answering questions from the public in the AMA (“Ask Me Anything”) format, and we were thrilled with the engagement we got from our users. You can browse through the AMA here: We are the City of Toronto’s Open Data team! Ask us anything!
That’s a wrap for 2019! Wishing you the best successes this new year.
 The Toronto Open Data Team