Quarterly Update (Q3 2025)

At Toronto Open Data, we’re putting in effort to make sure we work in the open. To that end, here’s a summary of what our team accomplished between July and September in 2025.
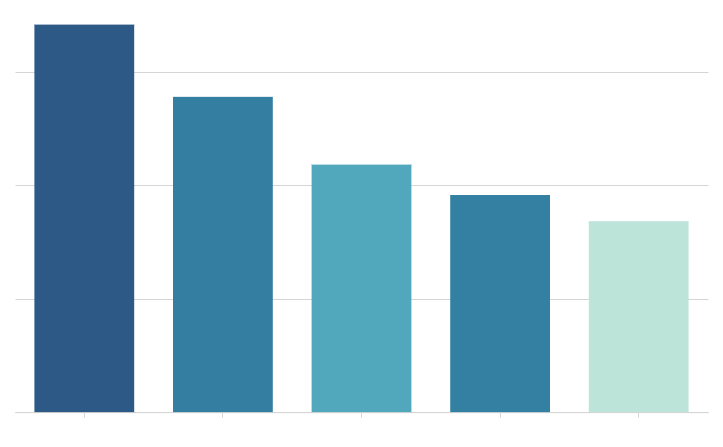
Overall Traffic

Our traffic tends to dip in Q3, and this year was no exception. In fact, this Q3 was slightly lower than previous years. That said, we don’t really consider this dip noteworthy because our 2 year overall traffic trend is still positive.

Dataset Traffic

With our dip in overall traffic, we did see datasets creep into our top ten most used that rarely do so. Most notable was our Parking Tickets dataset, which at the time of writing this is undergoing some upgrades to improve how its updated. We think this dataset’s traffic spiked because of some recent council activity on the subject. Similarly, council also requested the publication of Parking Lot Occupancy data, which coincidentally we published shortly before writing this article.

Equally noteworthy is seeing more traffic going towards promotions of the 2025 Open Data Awards, which we’re pretty excited about. Last year, successful candidates were featured on our site’s Gallery page, and were invited to show off their work to members of city leadership (including a city councilor).

Supporting Community

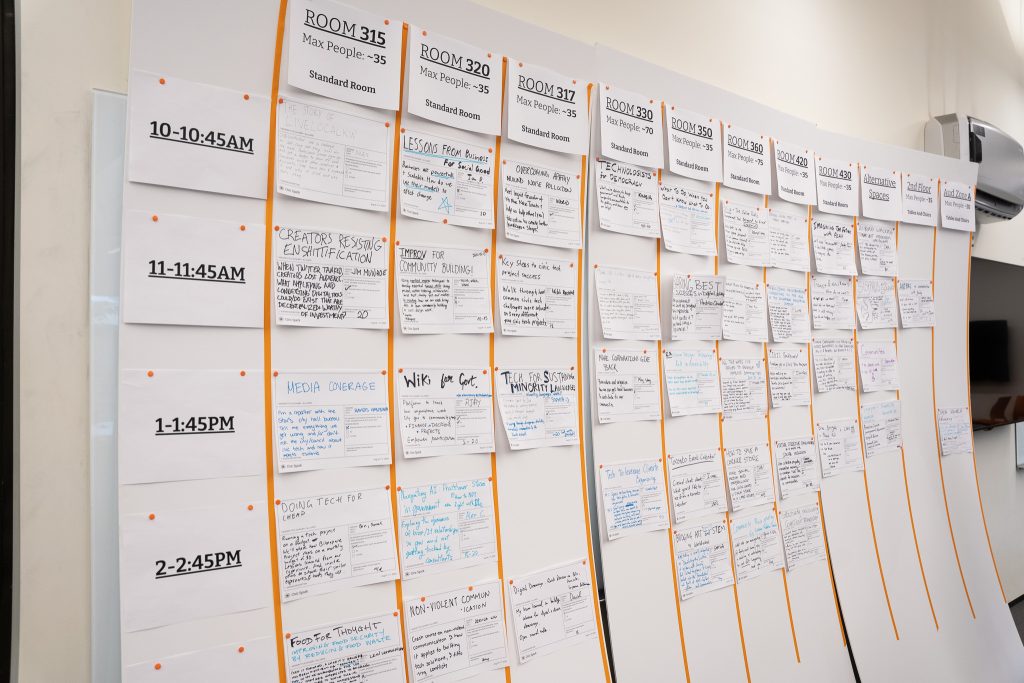
We played host to our friends at Civic Tech Toronto, hosting a few of their weekly hacknights at City Hall. If you didn’t already know, you can watch all the presentations on their Youtube channel.

We also sponsored Civic Spark, a 220 person strong, 2 day event focused on the themes of community involvement and public life (something, we believe, open data has a role in). The conference featured speakers from various levels of American and Canadian government, academic, and not-for-profit sectors (this included a co-inventor of one of Google’s search engine and web spam patents, a co-founder of Civic Tech Toronto and the Open Data Institute Toronto, and the former Chief of Staff for 18F (a digital services agency within the American Federal Government), and the former Chief Digital Officer for the Ontario Public Service.

What else?

  • We finished updating our dataset pages to address some long standing issues
  • We’ve drafted a new Open Data Policy for review by our Chief Technology Officer’s office
  • We made some upgrades to our Requests pages to add a bit more detail to each requests’ status
  • We’ve been iterating on a process to identify staff reports sent to council or committee that have open data in them

What’s next?

The rest of the year has a few things in store for Toronto Open Data. We’ll upgrade our site’s tool for exploring datasets, we’ll give our homepage a facelift, collect final submissions for the 2025 Open Data Awards, launch a new tool for collecting public inquiries, and work on our roadmap for 2026 and 2027.

Quarterly Update (Q2 2025)

At Toronto Open Data, we’re fans of working in the open. We’re the open data team, after all. We’re always looking for new ways to share our work, our code, our ideas and more with you.  

Starting with this blog, we’re going to share quarterly updates with news from the team, stats on how open data is being used in Toronto, and some peaks behind the curtain of how the program operates. Think of them as weeknotes, but like less often.  

So, without further ado, here’s what we got up to in Q2. 

Learning about our users 

We did some digging into the metrics for the City’s Open Data Portal and were pleasantly surprised! 

Between January 2023 and May 2025, we saw steady growth in activity on the portal. Sessions increased by four per cent, users by three per cent, and page views by five per cent. It’s not astronomical growth, but it’s always nice to see more people using the portal. 

The data also showed clear dips in activity over the summer and winter months, suggesting we get a lot of traffic and use from students and academic institutions. 

It’s challenging for us to learn about our users (the nature of open data means there’s no registration required to use our data, no requirement to share how you’re using it, etc.) so these kinds of insights are really valuable!  

Learning about our data 

In parallel, we looked at which open datasets are most popular. Neighbourhood Profiles, which break down a variety of census data by neighbourhood, continues to be the most viewed dataset.  

But beyond that, we noticed a clear relationship between open data use and current events.  

There was a massive spike in visitors to the City’s dangerous dogs dataset in 2024, coinciding with an unfortunate series of dog attacks – and resulting media coverage — in the first half of the year.  

Viewership of our election data also jumped in the summer of 2023, as residents and journalists sought out information on the mayoral by-election.  

Learning about our clients 

Lastly, we also looked at how the City’s 40+ divisions participate in the Open Data Program. What we found is that nearly half of the requests for publishing new or updating current data on the portal (~45%) is connected to just eight divisions. 

While that’s not necessarily cause for concern – it’s to be expected that some divisions are more data-rich or public-facing than others – it suggests there’s an opportunity for us to bring some of our colleagues up a few rungs on the ‘ladder of engagement.’  

Spoiler: we’re hoping that some of the new provisions we’re proposing as part of our policy refresh will do just that! 

Pushing policy forward 

Speaking of the policy refresh, we know we’ve been quiet on that front lately. We’ve pretty much finished drafting the new policy, and have been focused on moving it through the various bureaucratic checkpoints needed to make it an official City policy.  

One thing we’re happy to share is that the policy has been well received among staff, especially those who work with data. Based on our survey results, over 40% of respondents believe the new policy will have a positive impact on their work, compared to just over 10% who have some concerns. 

That much support for any change is a great signal! 

Supporting community 

We once again played host to our friends (and users!) at Civic Tech Toronto in May, helping them run their weekly hacknights out of City Hall! As always, you can watch all the presentations on their Youtube channel.  

We also partnered with the team at PROGRAM to run a 70-person, data-themed hackathon at City Hall in June. The aim was “to make Toronto the most programmable City in the world.” While we’re not sure we got to that lofty goal, we did get to see some cool projects make use of open data, ranging from an app that helps youth submit 311 requests to a website that shows new places and events in your area 

We also learned some things – like just how far vibe coding can take you – and met some cool people, which are the true KPIs of any hackathon!  

What’s next? 

By the next time we share one of these quarterly updates, we’re hoping to hit a few big milestones. We’re crossing our fingers that the new Open Data Policy will be in place by then, we’re hoping to release a public roadmap for the program in the fall, and we’re getting set to deploy some significant updates to the Open Data Portal’s UI, all of which were driven by user research.  

So stay tuned! 

Portal v2.4.8 – Release Notes

Why are we doing this release?

Open Data is changing how our backend prepares downloadable files for users. We’re doing this for 2 reasons:

  • Scalability – we were worried our previous logic would consume too much memory on our servers as our datasets grow in size
  • Shareability – we recreated this extension of our portal as an extension to CKAN (our portal’s backend platform), meaning other open data organizations using CKAN can copy our logic freely from GitHub

This will have 2 changes to how data is presented on the portal:

  1. All  “geometry” attributes will be converted to their Multi- counterpart. This helps reduce load on our servers when dealing with inconsistencies in geometric data quality from source data (ex: when Point and MultiPoint data are combines into a single schema)
  2. All shapefiles downloaded from datasets of type “Map” will, in the case of column names being longer than 10 characters, no longer be converted to the standard FIELD_1, FIELD_2, etc nomenclature. They will now be a shortened form of the actual column’s name. As before, we will keep a .txt file mapping the shortened name to the entire name zipped in the shapefile.

Changes to downloaded data’s structure will not effect all datasets immediately – these changes will occur on each dataset as they are updated through their existing refresh processes.

Release notes

Open Data Toronto CKAN Extension

https://github.com/open-data-toronto/ckan-customization-open-data-toronto
Tag v2.4.8

  • Iotrans module replaced with ckanext-iotrans
  • Python files refactored to follow PEP8 and PEP257
  • Following Python dependencies removed:
    • Pandas
    • Geopandas
    • Shapely
    • Pyproj
    • Numpy
    • Iotrans

Iotrans CKAN Extension

Tag v1.2.3

  • Replaces iotrans python module for file format and EPSG conversion
  • Streams data from disk, reducing memory load significantly
  • Is a CKAN extension, meaning it can be used by other CKAN-using organizations freely

Changes

  • All geometries are considered “Multi” geometries to ensure there is no geometry type conflicts within a spatial dataset schema
  • All “geometry” fields in created CSV files now use square brackets instead of round parentheses
  • All output shapefile ZIPs will:
    • have their column names reduced to the first 7 characters plus an incrementing integer. This ensures output shapefiles will not violate a shapefile’s 10 character column name length limit and have uniquely named columns that resemble their original name
    • continue to have a .txt file zipped with them mapping the created name to the original name