
Toronto Multiplex Tracker
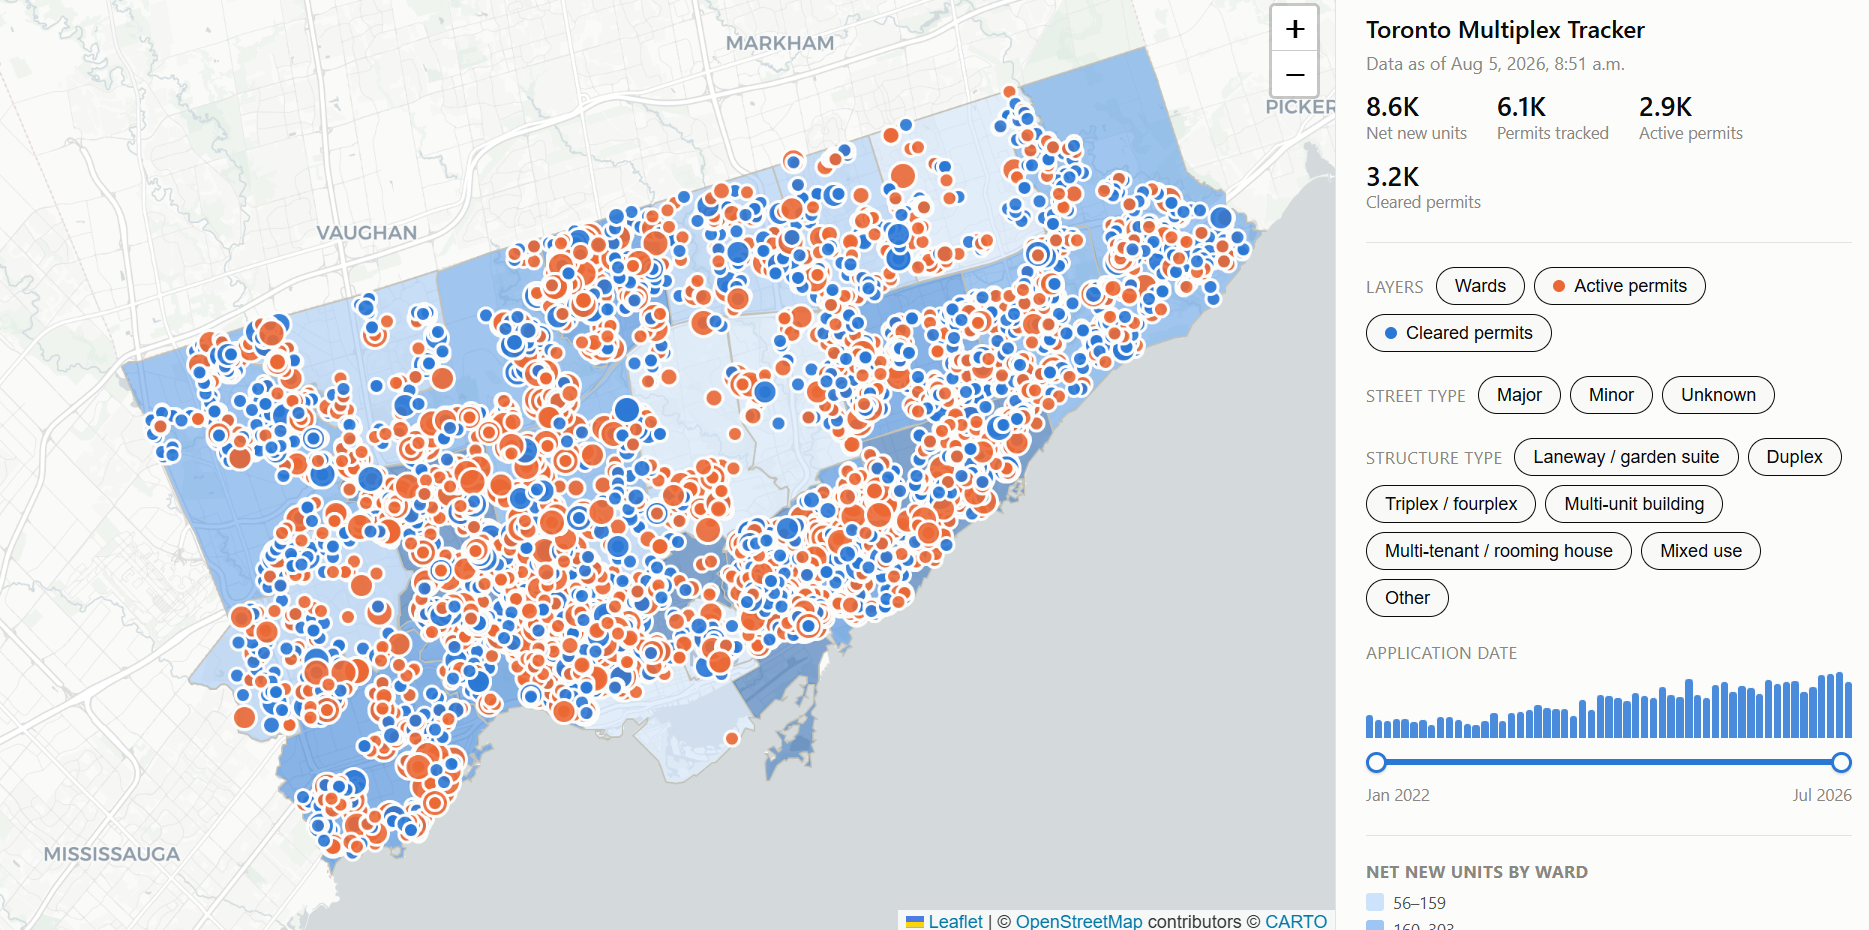
Live map of gentle density permits, refreshed daily
This tracks every building permit creating 1–6 dwelling units in Toronto since 2022, refreshed daily from the City’s Open Data.
The Map tab shows where they are, one dot per permit, with wards shaded by how many units their permits add up to. The Trends tab shows the same permits over time, counting either as applications or units.
Where the data comes from
Everything is pulled straight from Toronto Open Data — the active and cleared building permit datasets, geocoded against the City’s municipal address points and joined to ward boundaries. A scheduled job refreshes the whole chain daily. You can download the exact data behind the map as GeoJSON, and the code that builds it is on GitHub.
Caveats worth knowing
A permit is not a finished building — active permits may stall or be abandoned, and cleared permits are the only ones confirmed complete. Permits whose address can’t be matched to an address point are counted in the ward totals but can’t be drawn as points.
Unit counts are gross, not net. The raw data includes a “dwelling units lost” figure but it’s left at zero on virtually every permit, so there is no reliable way to subtract what a demolition removed.